Postgres&Prometheus&Grafana服务监控

PostgreSQL(被监控对象)

1
docker pull postgres:latest

PostgresSQL-Exporter(参数暴露器)

1
docker pull postgres-exporter:latest

Prometheus(日志收集器)

1
docker pull prom/prometheus

Grafana(可视化工具)

1
docker pull grafana/grafana

PostgreSQL+PostgreSQLExporter+Prometheus+Grafana

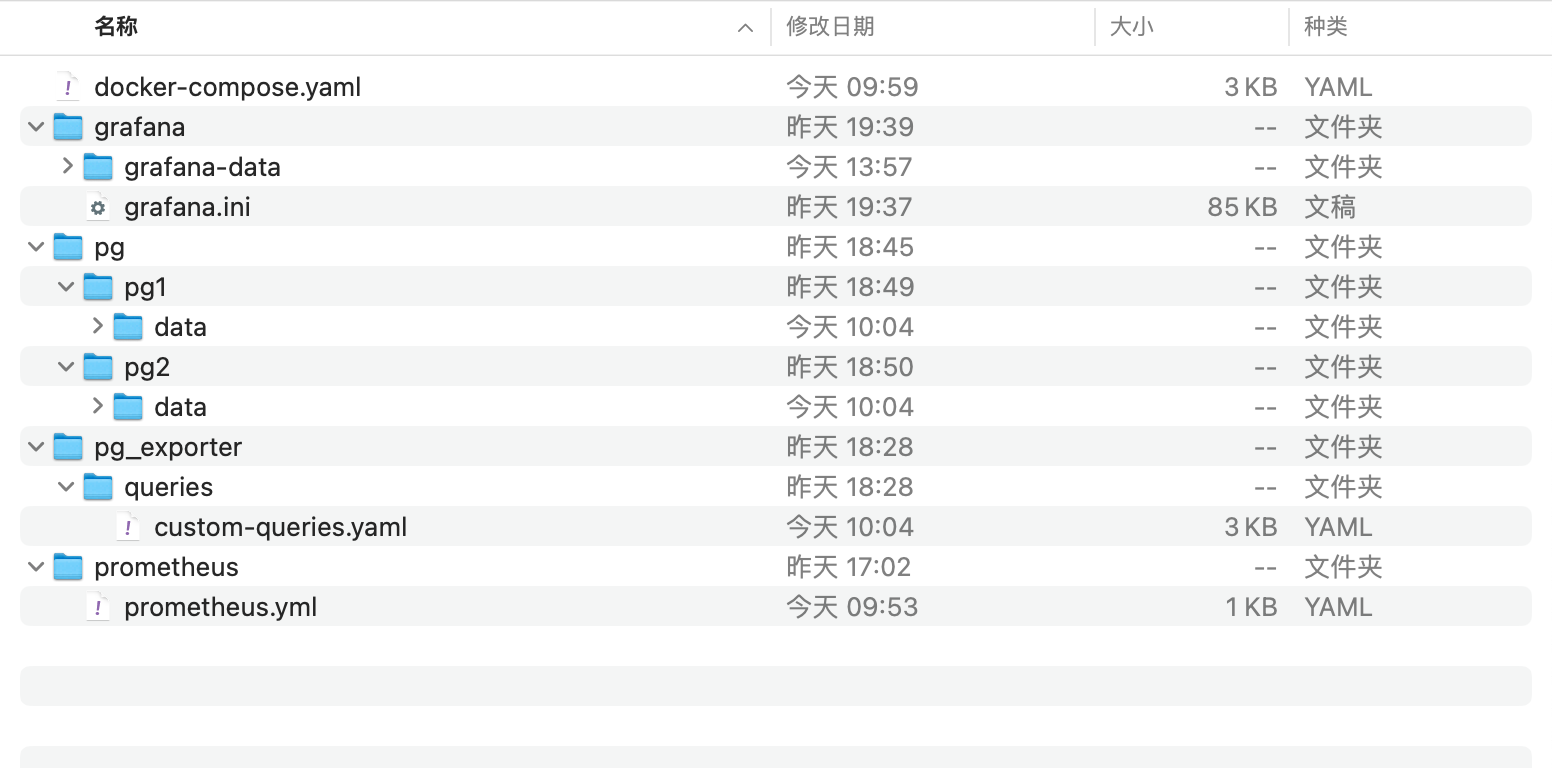
1. 编写docker启动配置文件docker-compose.yaml

1
2
3
4
5
6
7
8
9
10
11
12
13
14
15
16
17
18
19
20
21
22
23
24
25
26
27
28
29
30
31
32
33
34
35
36
37
38
39
40
41
42
43
44
45
46
47
48
49
50
51
52
53
54
55
56
57
58
59
60
61
62
63
64
65
66
67
68
69
70
71
72
73
74
75
76
77
78
79
80
81
82
83
84
85
86
87
88
89
90
91
92
93
94
95
96
97
98
99
100
101
102
103
104
version: "3"

# 创建docker网络 让当前容器可以通过容器标识名称进行通信
networks:
default:
driver: bridge

services:
# 创建一个postgres应用
db1:
image: postgres
restart: always
container_name: gpg_db1
ports:
- 15432:5432
environment:
POSTGRES_DB: postgres
POSTGRES_USER: postgres
POSTGRES_PASSWORD: 123456
# set shared memory limit when using docker compose
shm_size: 128mb

volumes:
- ./pg/pg1/data:/var/lib/postgresql/data
networks:
- default

# db2:
# image: postgres
# restart: always
# container_name: gpg_db2
# ports:
# - 15433:5432
# environment:
# POSTGRES_DB: postgres
# POSTGRES_USER: postgres
# POSTGRES_PASSWORD: 123456
# # set shared memory limit when using docker compose
# shm_size: 128mb
# volumes:
# - ./pg/pg2/data:/var/lib/postgresql/data
# networks:
# - default

# 创建一个postgresql指标参数暴露应用
postgres-exporter1:
image: quay.io/prometheuscommunity/postgres-exporter:v0.13.0
container_name: postgres-exporter1
restart: always
ports:
- "19187:9187" # 暴露指标端口
environment:
DATA_SOURCE_NAME: "postgresql://postgres:123456@db1:5432/postgres?sslmode=disable"
command:
- '--extend.query-path=/queries/custom-queries.yaml' # 可选:自定义查询路径
volumes:
- ./pg_exporter/queries:/queries # 挂载自定义查询文件(如果有)
networks:
- default


# postgres-exporter2:
# image: quay.io/prometheuscommunity/postgres-exporter:v0.13.0
# container_name: postgres-exporter2
# restart: always
# ports:
# - "19188:9187" # 暴露指标端口
# environment:
# DATA_SOURCE_NAME: "postgresql://postgres:123456@db2:5432/postgres?sslmode=disable"
# command:
# - '--extend.query-path=/queries/custom-queries.yaml' # 可选:自定义查询路径
# volumes:
# - ./pg_exporter/queries:/queries # 挂载自定义查询文件(如果有)
# networks:
# - default

# 创建Prometheus进行指标数据采集
prometheus:
image: prom/prometheus
container_name: prometheus
command:
- '--config.file=/etc/prometheus/prometheus.yml'
- '--storage.tsdb.path=/prometheus/'
volumes:
- ./prometheus/prometheus.yml:/etc/prometheus/prometheus.yml
ports:
- 19090:9090
networks:
- default

# 创建Grafana,进行指标数据可视化
grafana:
image: grafana/grafana
container_name: grafana
ports:
- 13000:3000
volumes:
- ./grafana/grafana-data:/var/lib/grafana # 持久化数据目录
- ./grafana/grafana.ini:/etc/grafana/grafana.ini # 可选:持久化配置文件
environment:
- GF_SECURITY_ADMIN_USER=admin
- GF_SECURITY_ADMIN_PASSWORD=admin
networks:
- default

2. 配置Prometheus对postgresql_exporter的数据

1
2
3
4
5
6
7
8
9
10
11
12
13
14
15
16
17
18
19
20
21
22
23
24
25
26
27
28
29
30
31
32
33
34
35
36
37
38
global:
scrape_interval: 3s # 全局默认抓取间隔时间,所有抓取任务的默认频率为15秒
external_labels:
monitor: my_postgres_exporter
scrape_configs:
- job_name: 'postgres1'
static_configs:
- targets: ['host.docker.internal:19187']
metrics_path: /metrics
params:
sslmode: ['disable']
basic_auth:
username: 'postgres' # Exporter 连接数据库的用户名
password: '123456' # Exporter 连接数据库的密码
relabel_configs:
- source_labels: [__address__]
regex: "(.*):(.*)"
target_label: instance
replacement: $1
- target_label: env
replacement: 'local' # 添加环境标签

# - job_name: 'postgres2'
# static_configs:
# - targets: ['host.docker.internal:19188']
# metrics_path: /metrics
# params:
# sslmode: ['disable']
# basic_auth:
# username: 'postgres' # Exporter 连接数据库的用户名
# password: '123456' # Exporter 连接数据库的密码
# relabel_configs:
# - source_labels: [__address__]
# regex: "(.*):(.*)"
# target_label: instance
# replacement: $1
# - target_label: env
# replacement: 'local' # 添加环境标签

3. 配置postgres_exporter的客户查询配置文件: customer_queries.yaml

1
2
3
4
5
6
7
8
9
10
11
12
13
14
15
16
17
18
19
20
21
22
23
24
25
26
27
28
29
30
31
32
33
34
35
36
37
38
39
40
41
42
43
44
45
46
47
48
49
50
51
52
53
54
55
56
57
58
59
60
61
62
63
64
65
66
67
68
69
70
71
72
73
74
75
76
77
78
79
80
81
82
83
84
85
86
87
88
89
90
91
92
93
94
95
96
97
98
99
100
101
102
103
104
# 连接状态
connections:
query: |
SELECT
datname AS database,
state,
COUNT(*) AS count
FROM pg_stat_activity
GROUP BY datname, state
metrics:
- database: { type: label }
- state: { type: label }
- count: { type: gauge, help: "当前连接数" }

# 表大小
table_size:
query: |
SELECT
schemaname || '.' || relname AS table_name,
pg_total_relation_size(relid) AS total_bytes
FROM pg_stat_user_tables
metrics:
- table_name: { type: label }
- total_bytes: { type: gauge, help: "表总大小(字节)" }

# 慢查询(需 pg_stat_statements 扩展)
slow_queries:
query: |
SELECT
queryid,
substring(query FOR 100) AS short_query,
total_time / 1000 AS total_seconds
FROM pg_stat_statements
ORDER BY total_time DESC
LIMIT 10
metrics:
- queryid: { type: label }
- short_query: { type: label }
- total_seconds: { type: gauge, help: "查询总执行时间(秒)" }
cache_seconds: 300


pg_stat_activity_count:
query: "SELECT datname, usename, state, count(*) AS count FROM pg_stat_activity GROUP BY datname, usename, state;"
metrics:
- datname:
usage: "LABEL"
description: "数据库名称"
- usename:
usage: "LABEL"
description: "用户名"
- state:
usage: "LABEL"
description: "连接状态(如 idle、active 等)"
- count:
usage: "GAUGE"
description: "对应状态的连接数量"


pg_tablespace_size:
query: "SELECT spcname, pg_tablespace_size(spcname) AS size FROM pg_tablespace;"
metrics:
- spcname:
usage: "LABEL"
description: "表空间名称"
- size:
usage: "GAUGE"
description: "表空间使用大小(字节)"


pg_database_io:
query: "SELECT datname, xact_commit, xact_rollback, blks_read, blks_hit FROM pg_stat_database;"
metrics:
- datname:
usage: "LABEL"
description: "数据库名称"
- xact_commit:
usage: "COUNTER"
description: "事务提交次数"
- xact_rollback:
usage: "COUNTER"
description: "事务回滚次数"
- blks_read:
usage: "COUNTER"
description: "从磁盘读取的块数"
- blks_hit:
usage: "COUNTER"
description: "缓冲区命中的块数"

4. 启动docker服务并检查各服务状态

1
docker-compose up

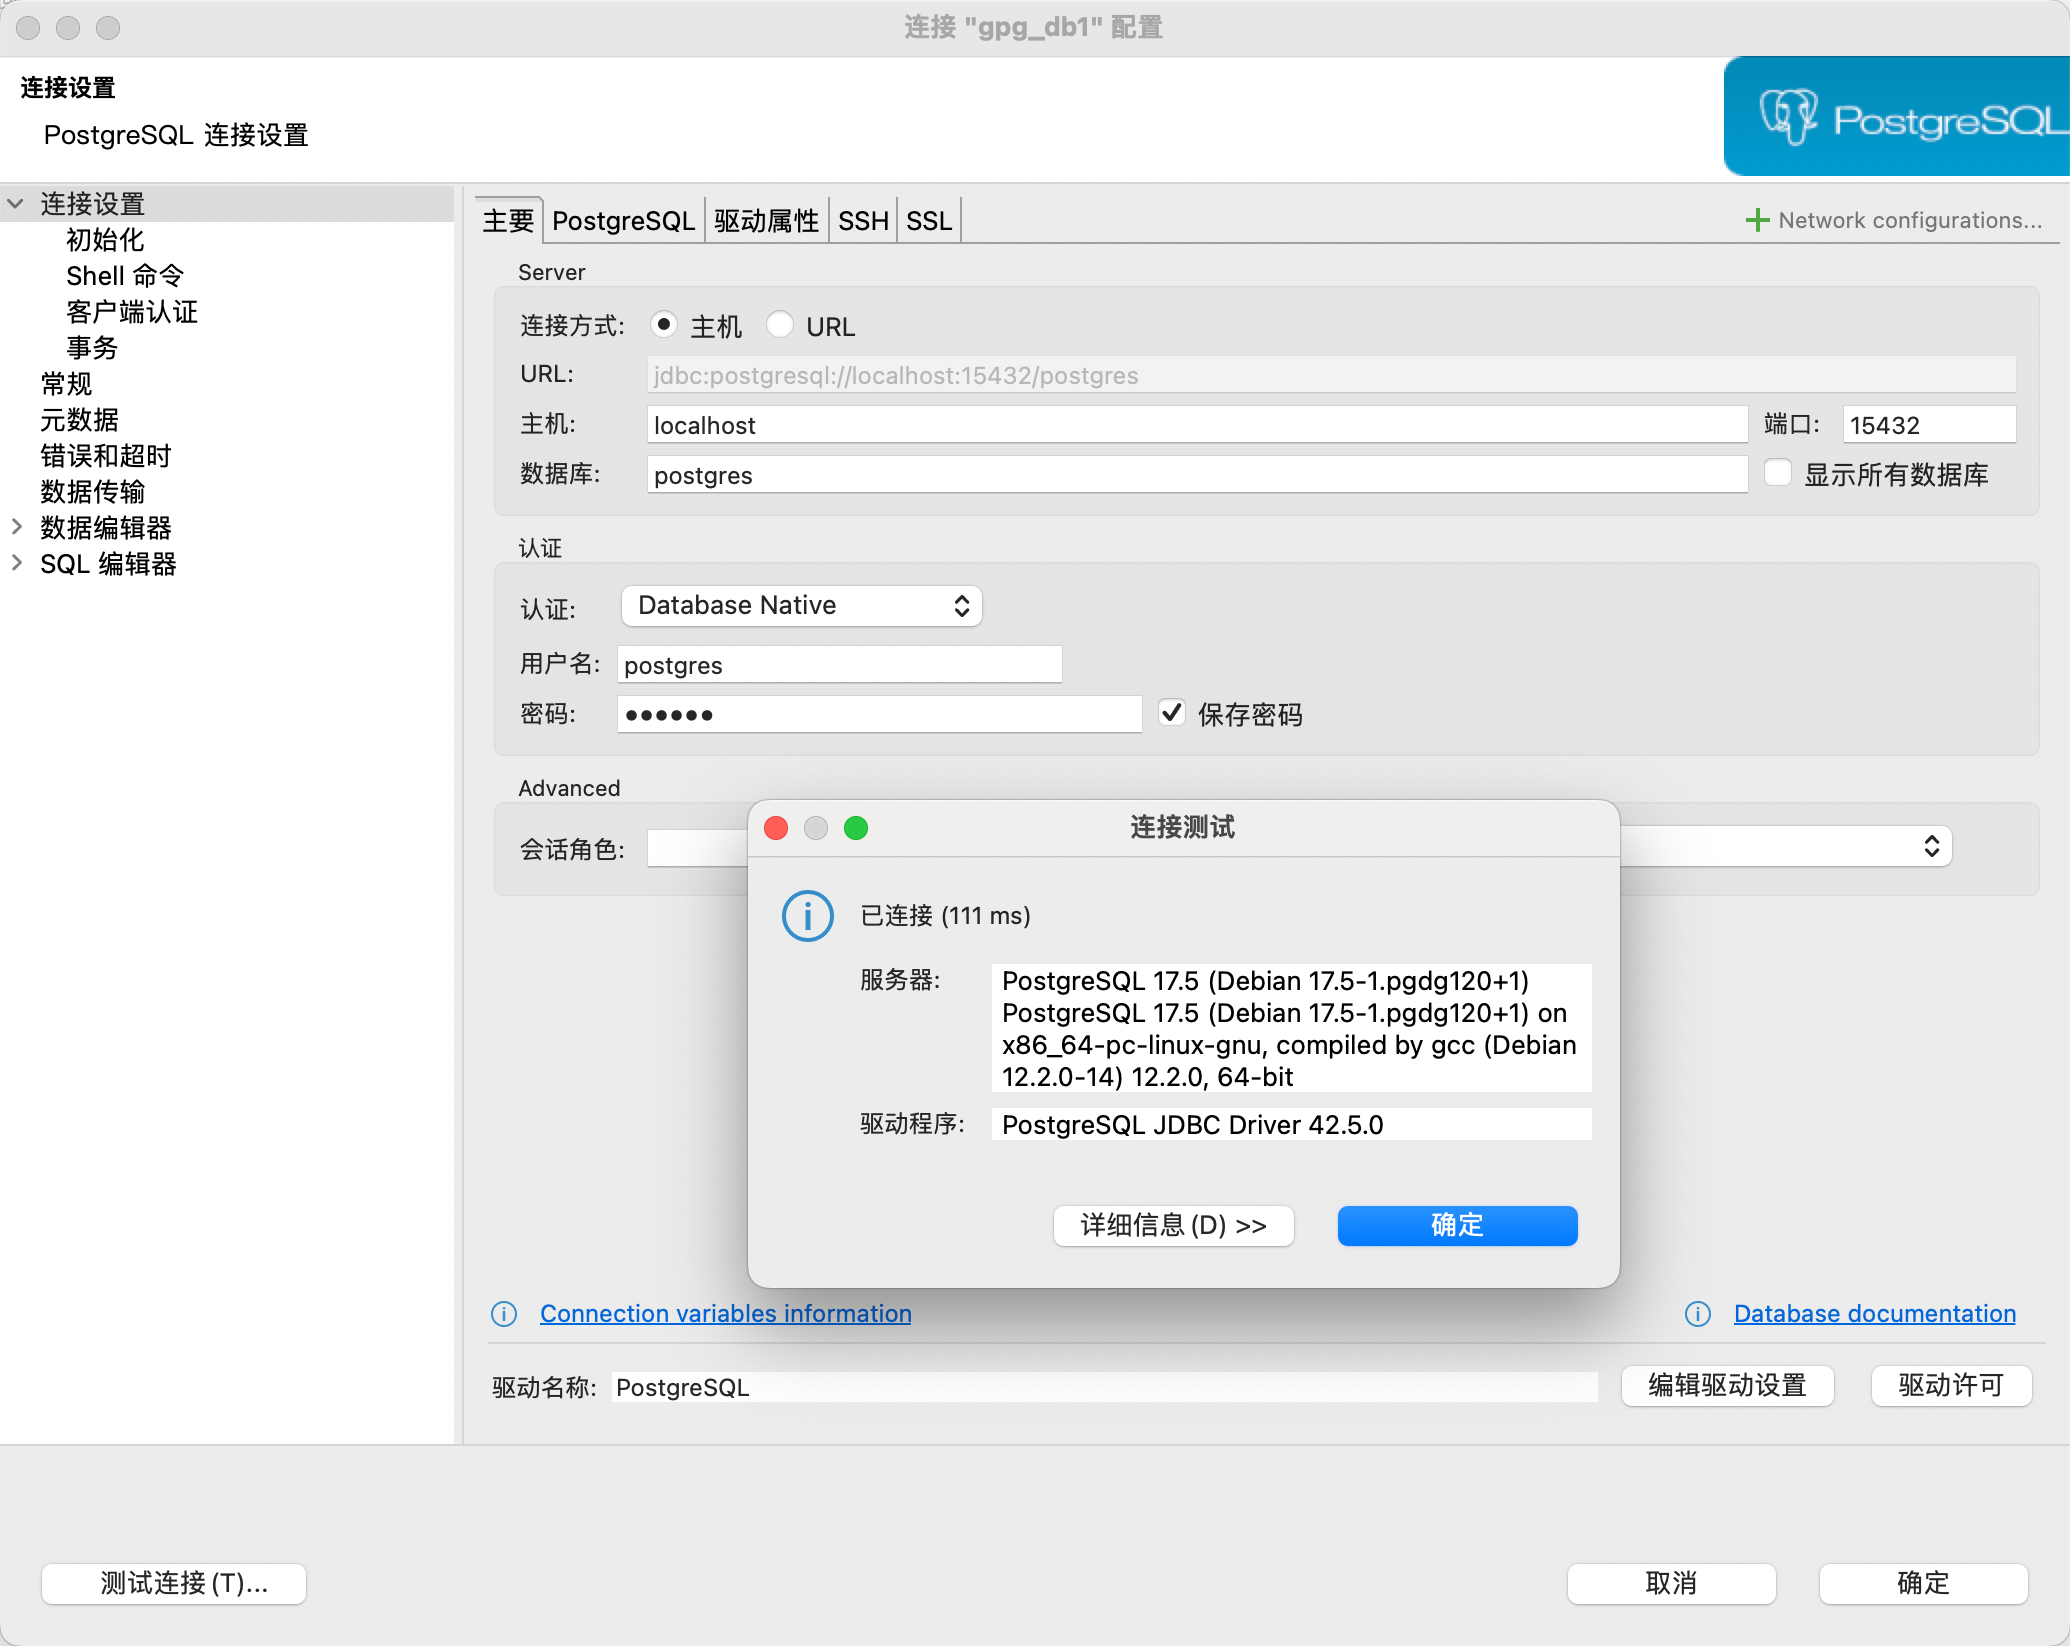
4.1 检查postgres应用实例是否启动成功

1
可以通过数据库连接工具进行连接测试

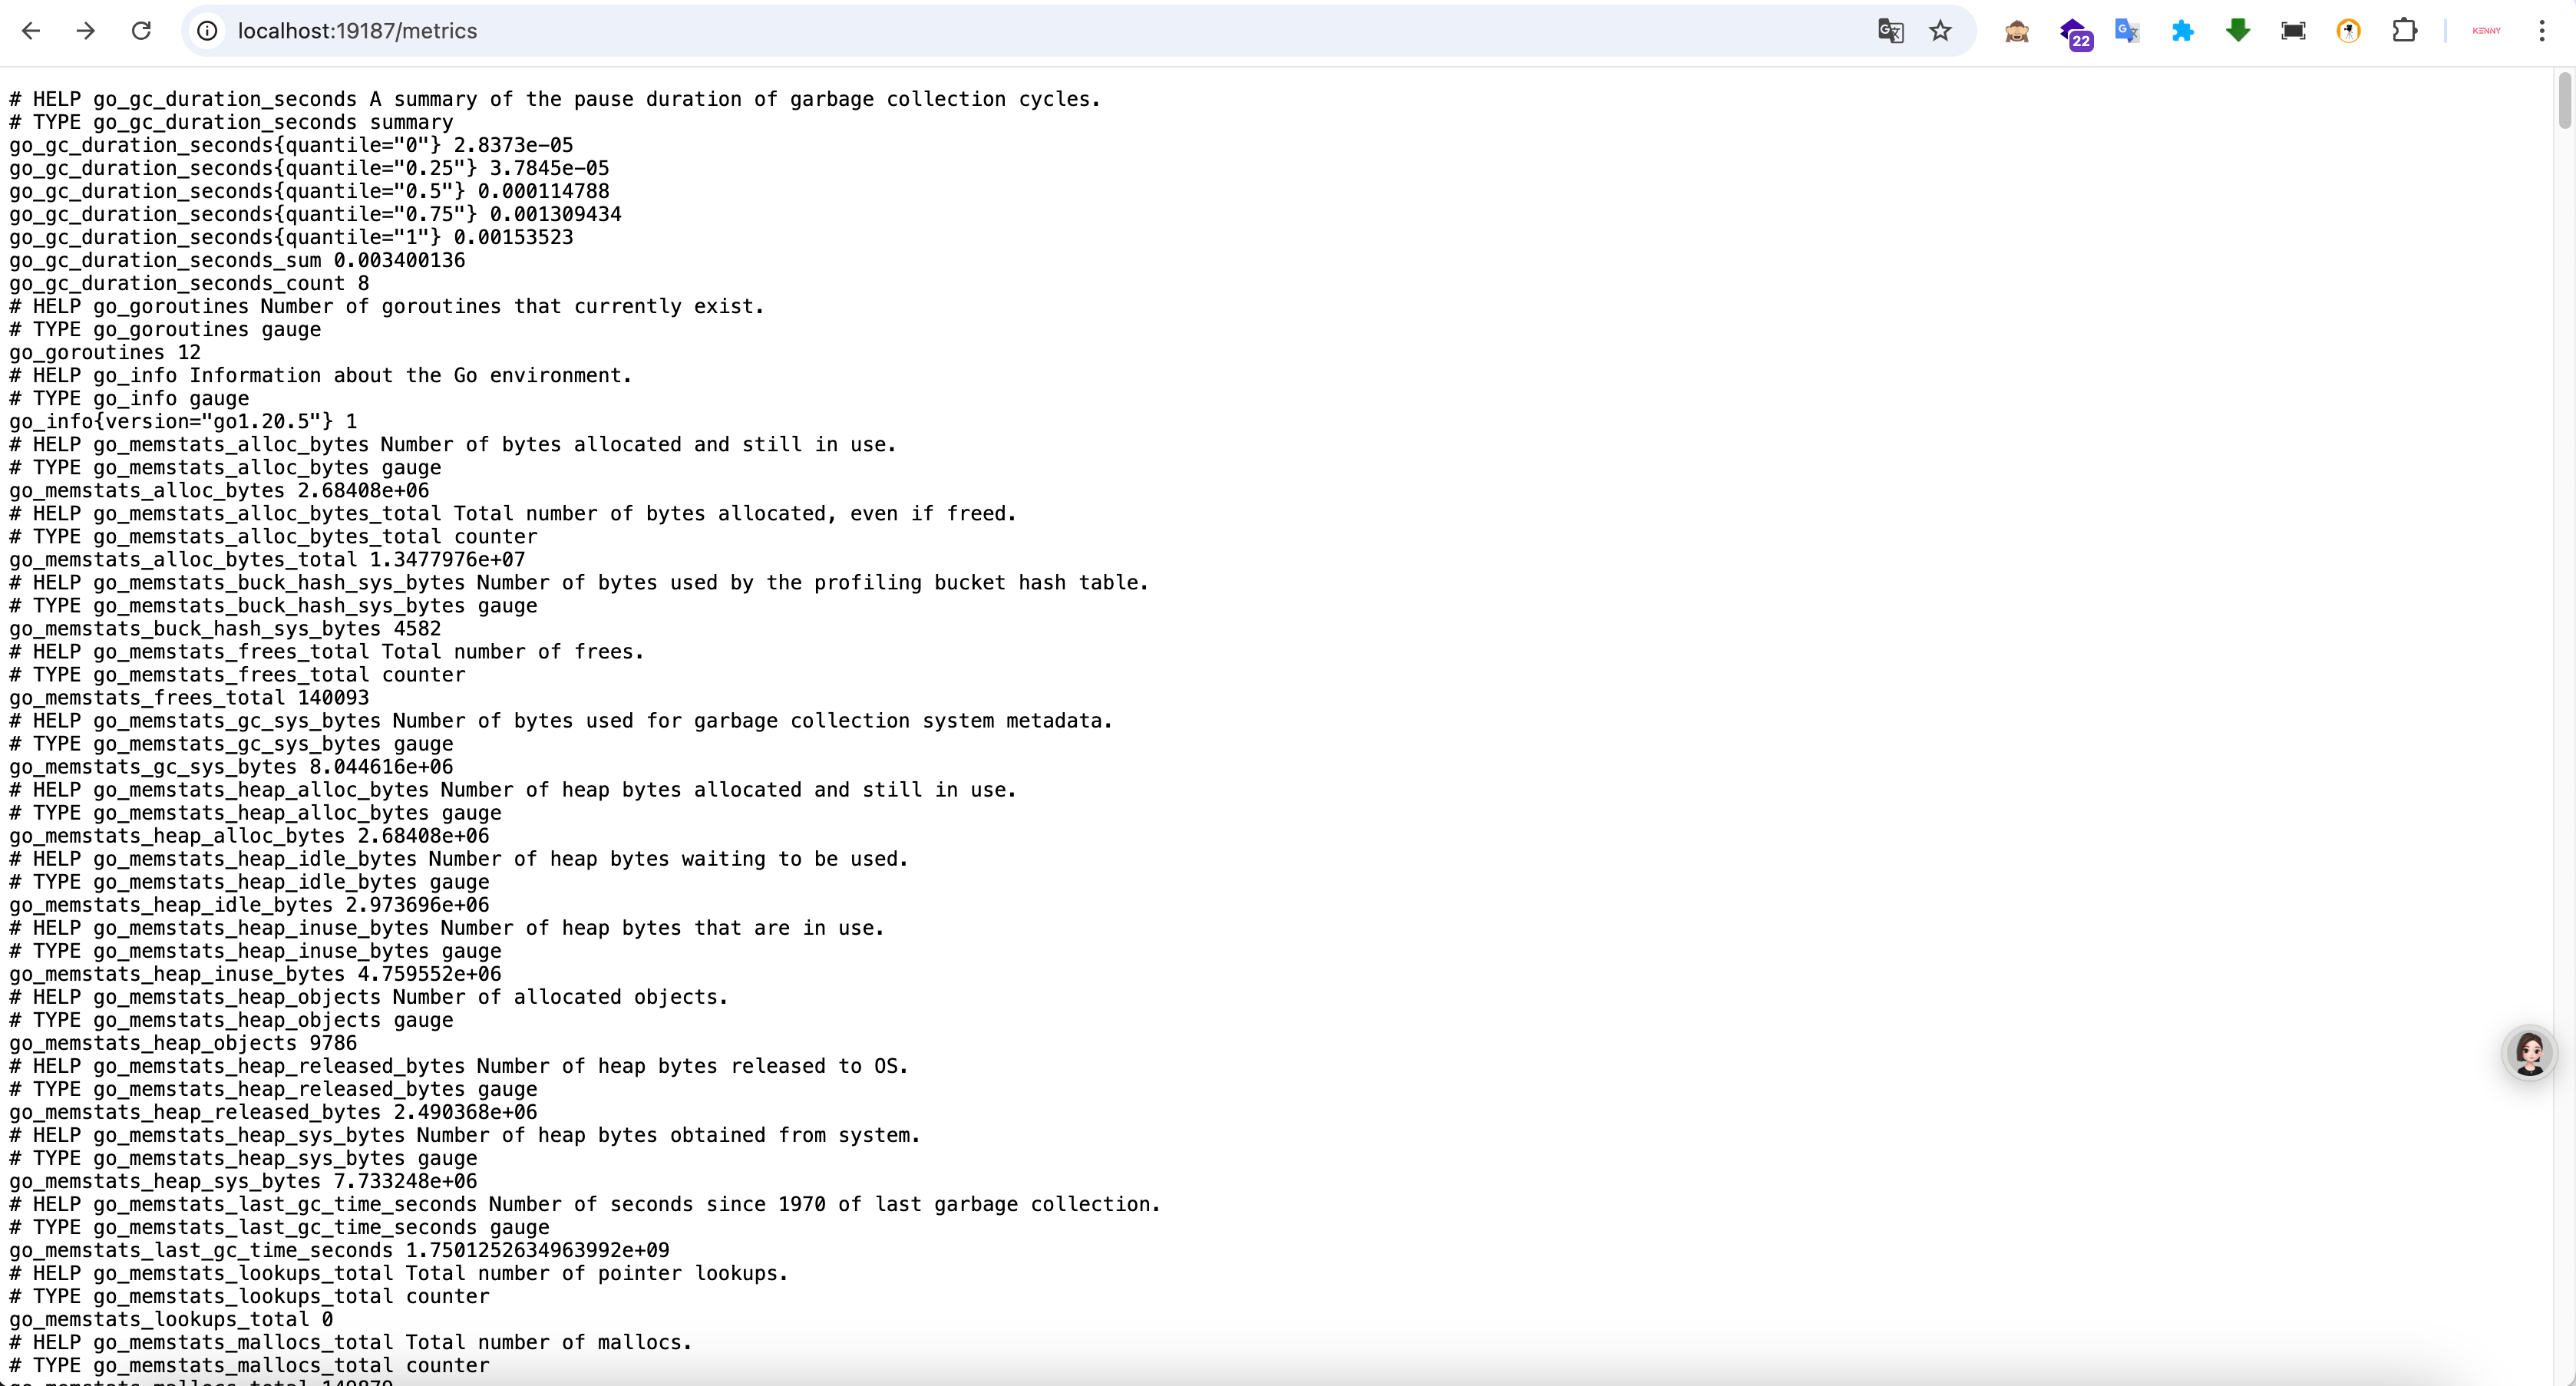
4.2 查看postgresql_exporter1是否监控db1成功

1
http://localhost:19187/metrics

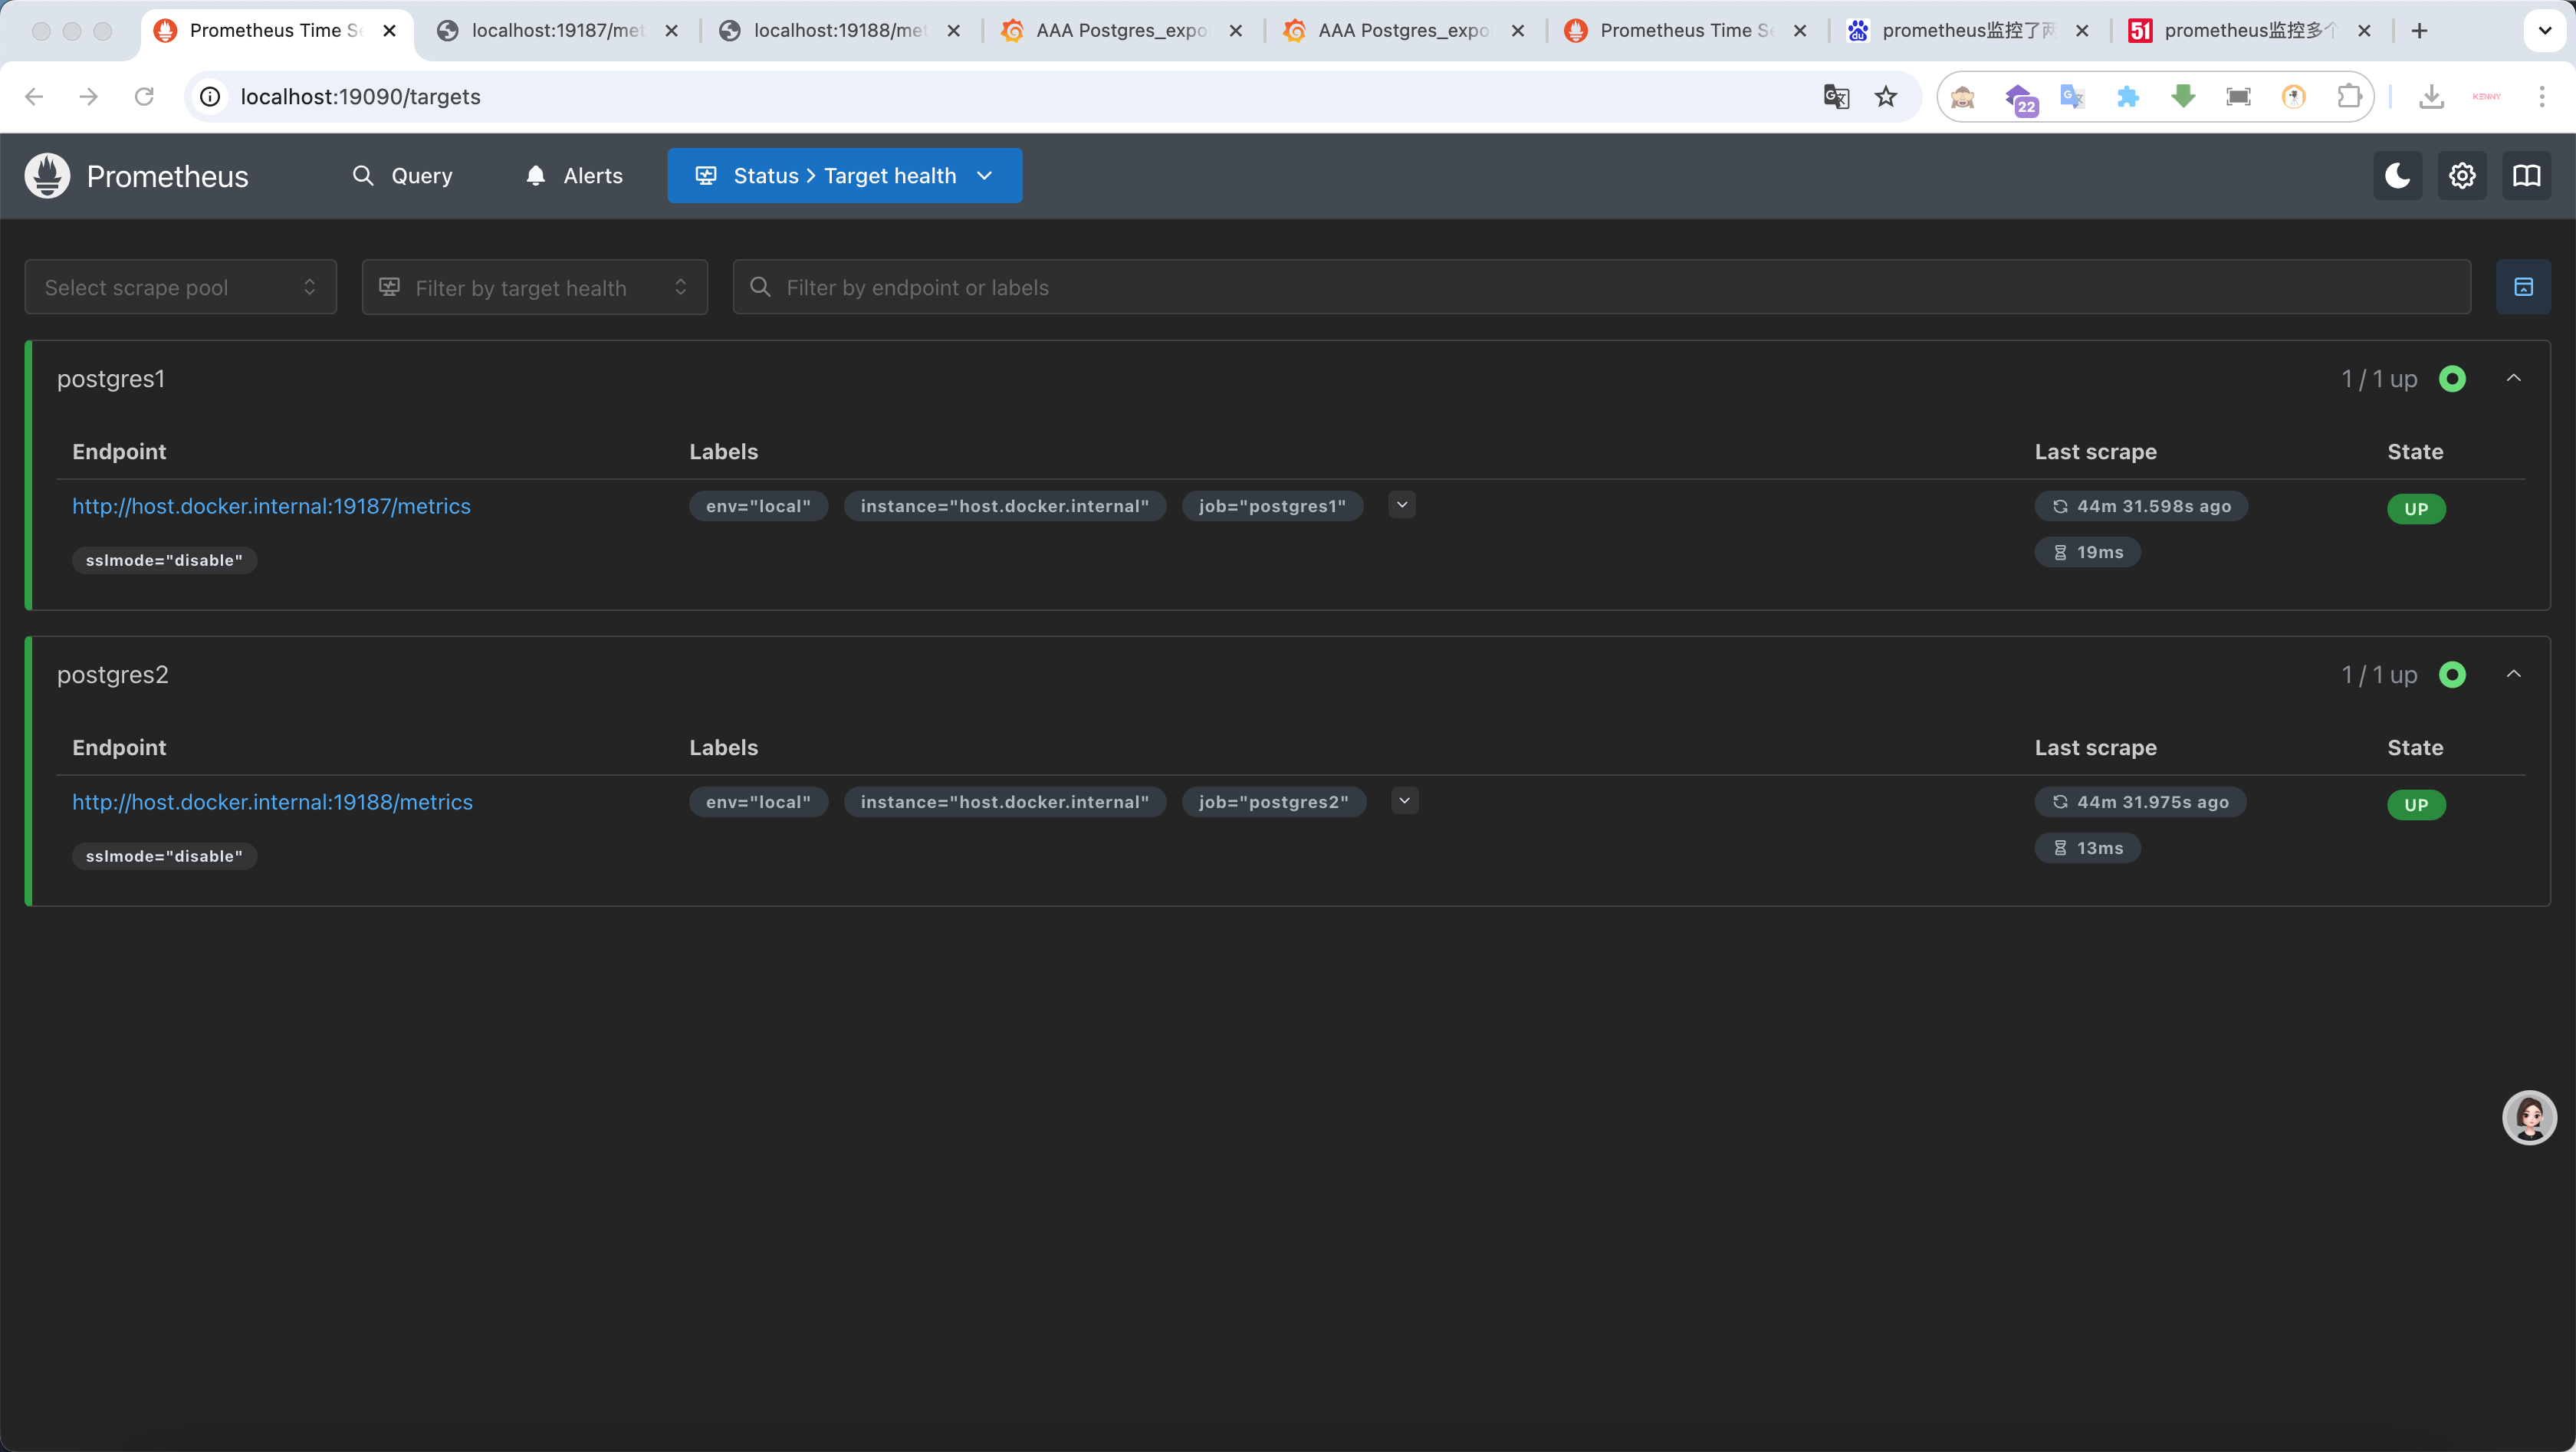
4.3 检查Prometheus Status中的监控实例是否获取成功

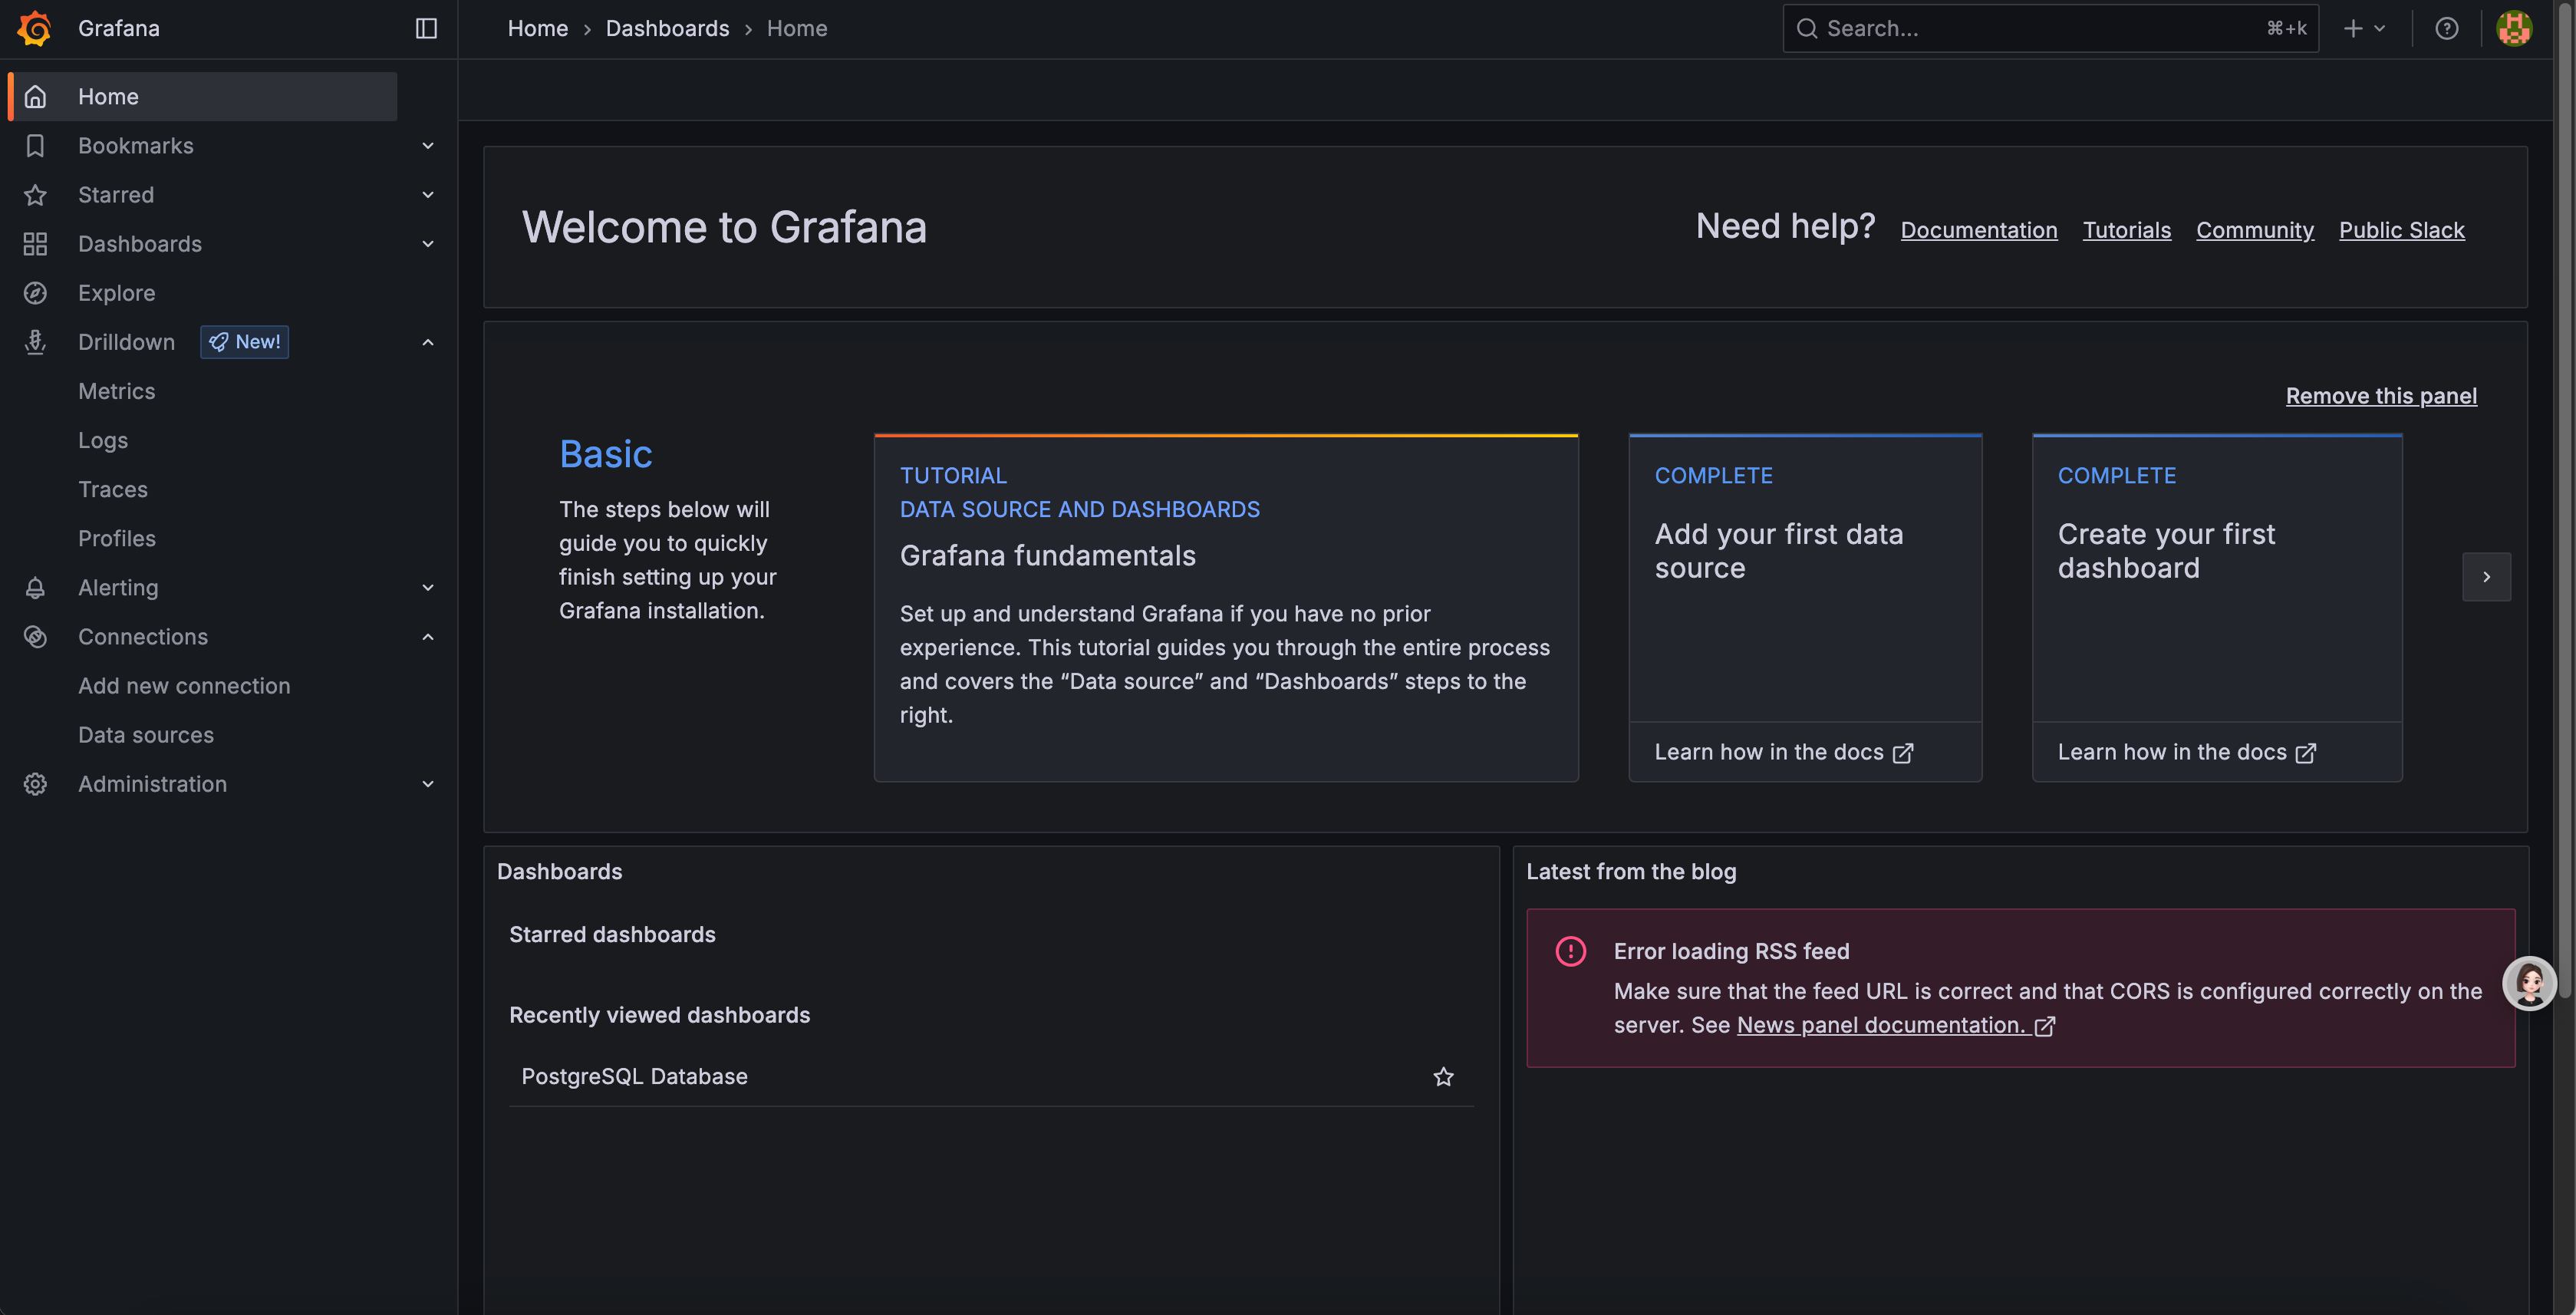
4.4 检查Grafana是否启动成功

1
2
http://localhost:13000
# 账密 admin / admin

4.5 配置Grafana获取Prometheus的监控数据并可视化PostgreSQL

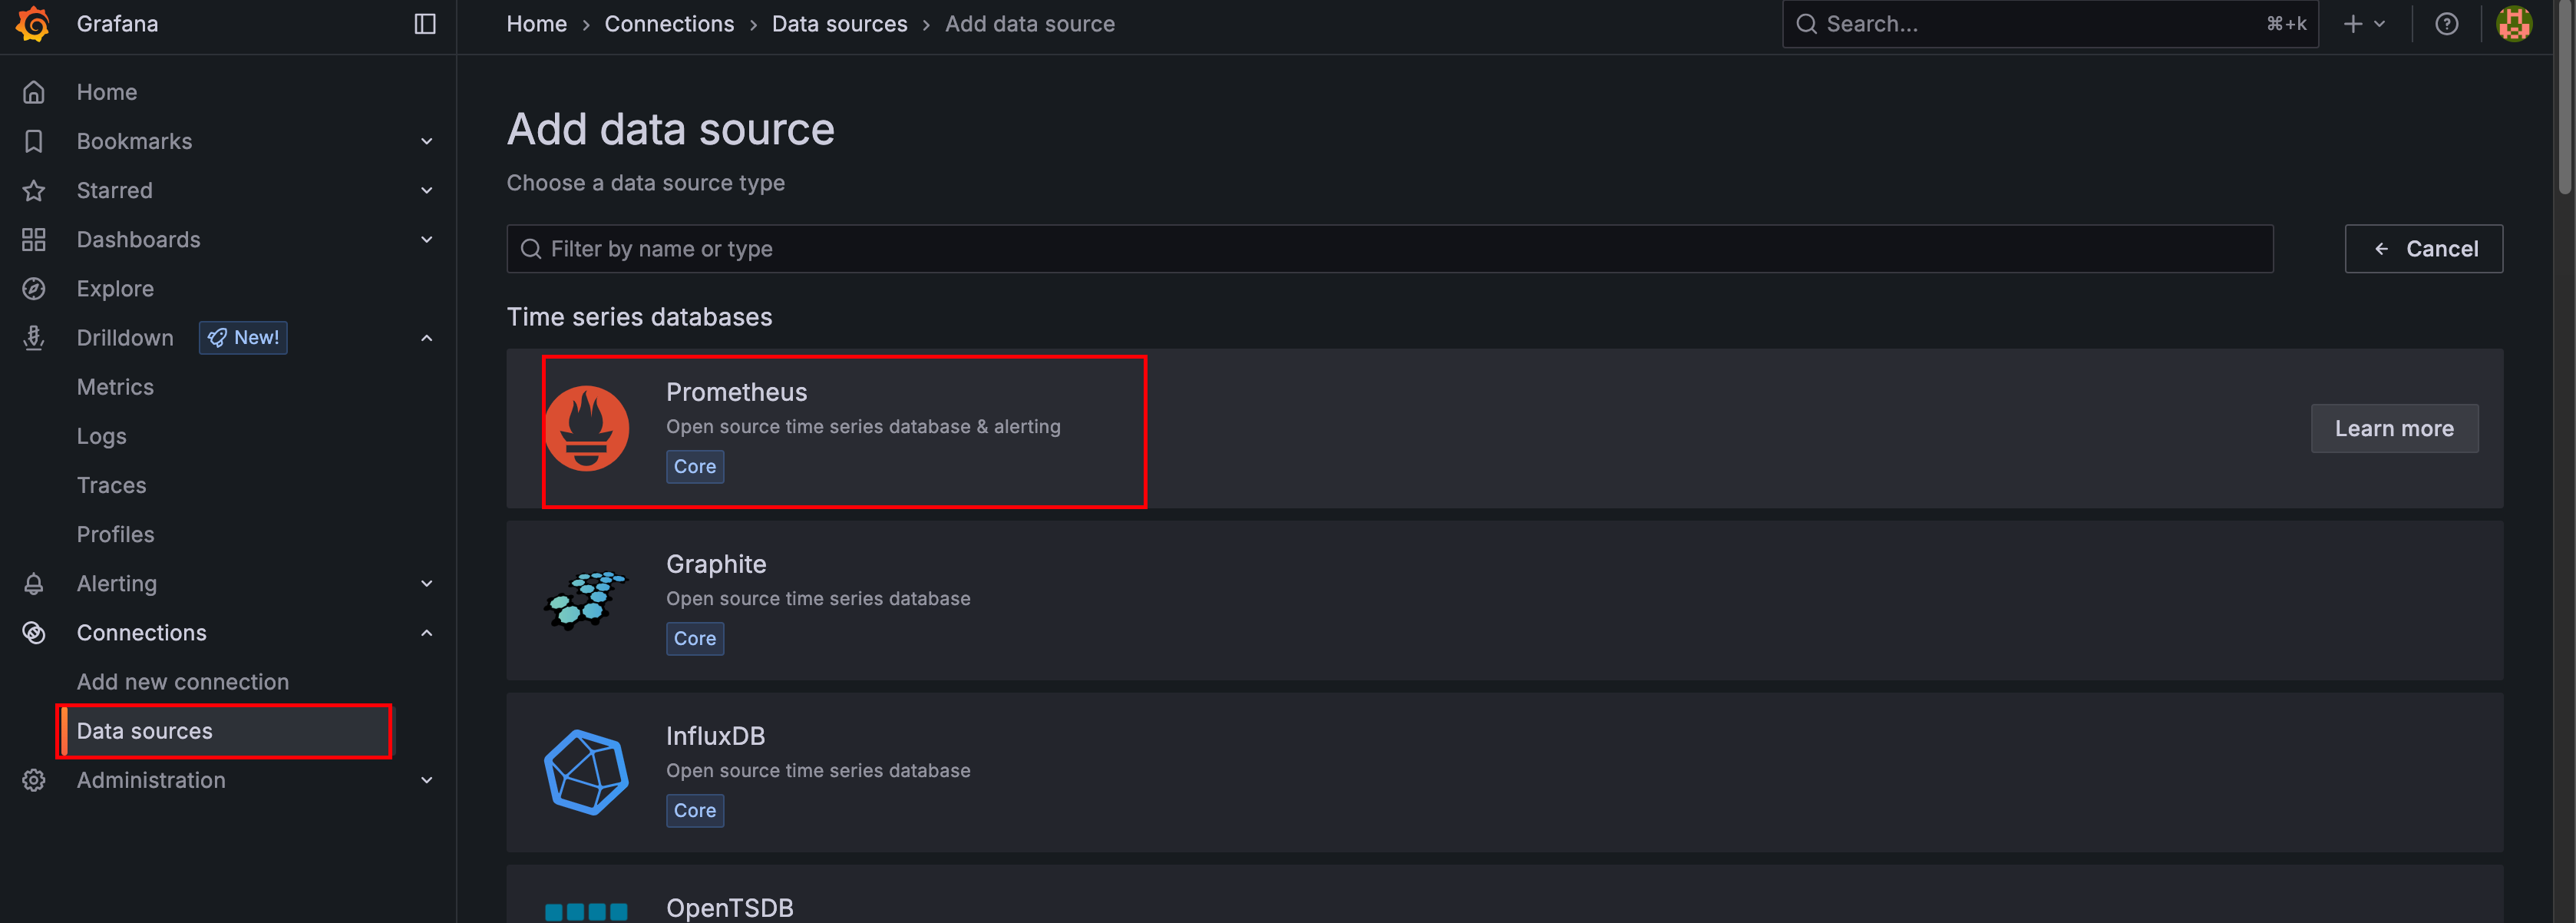
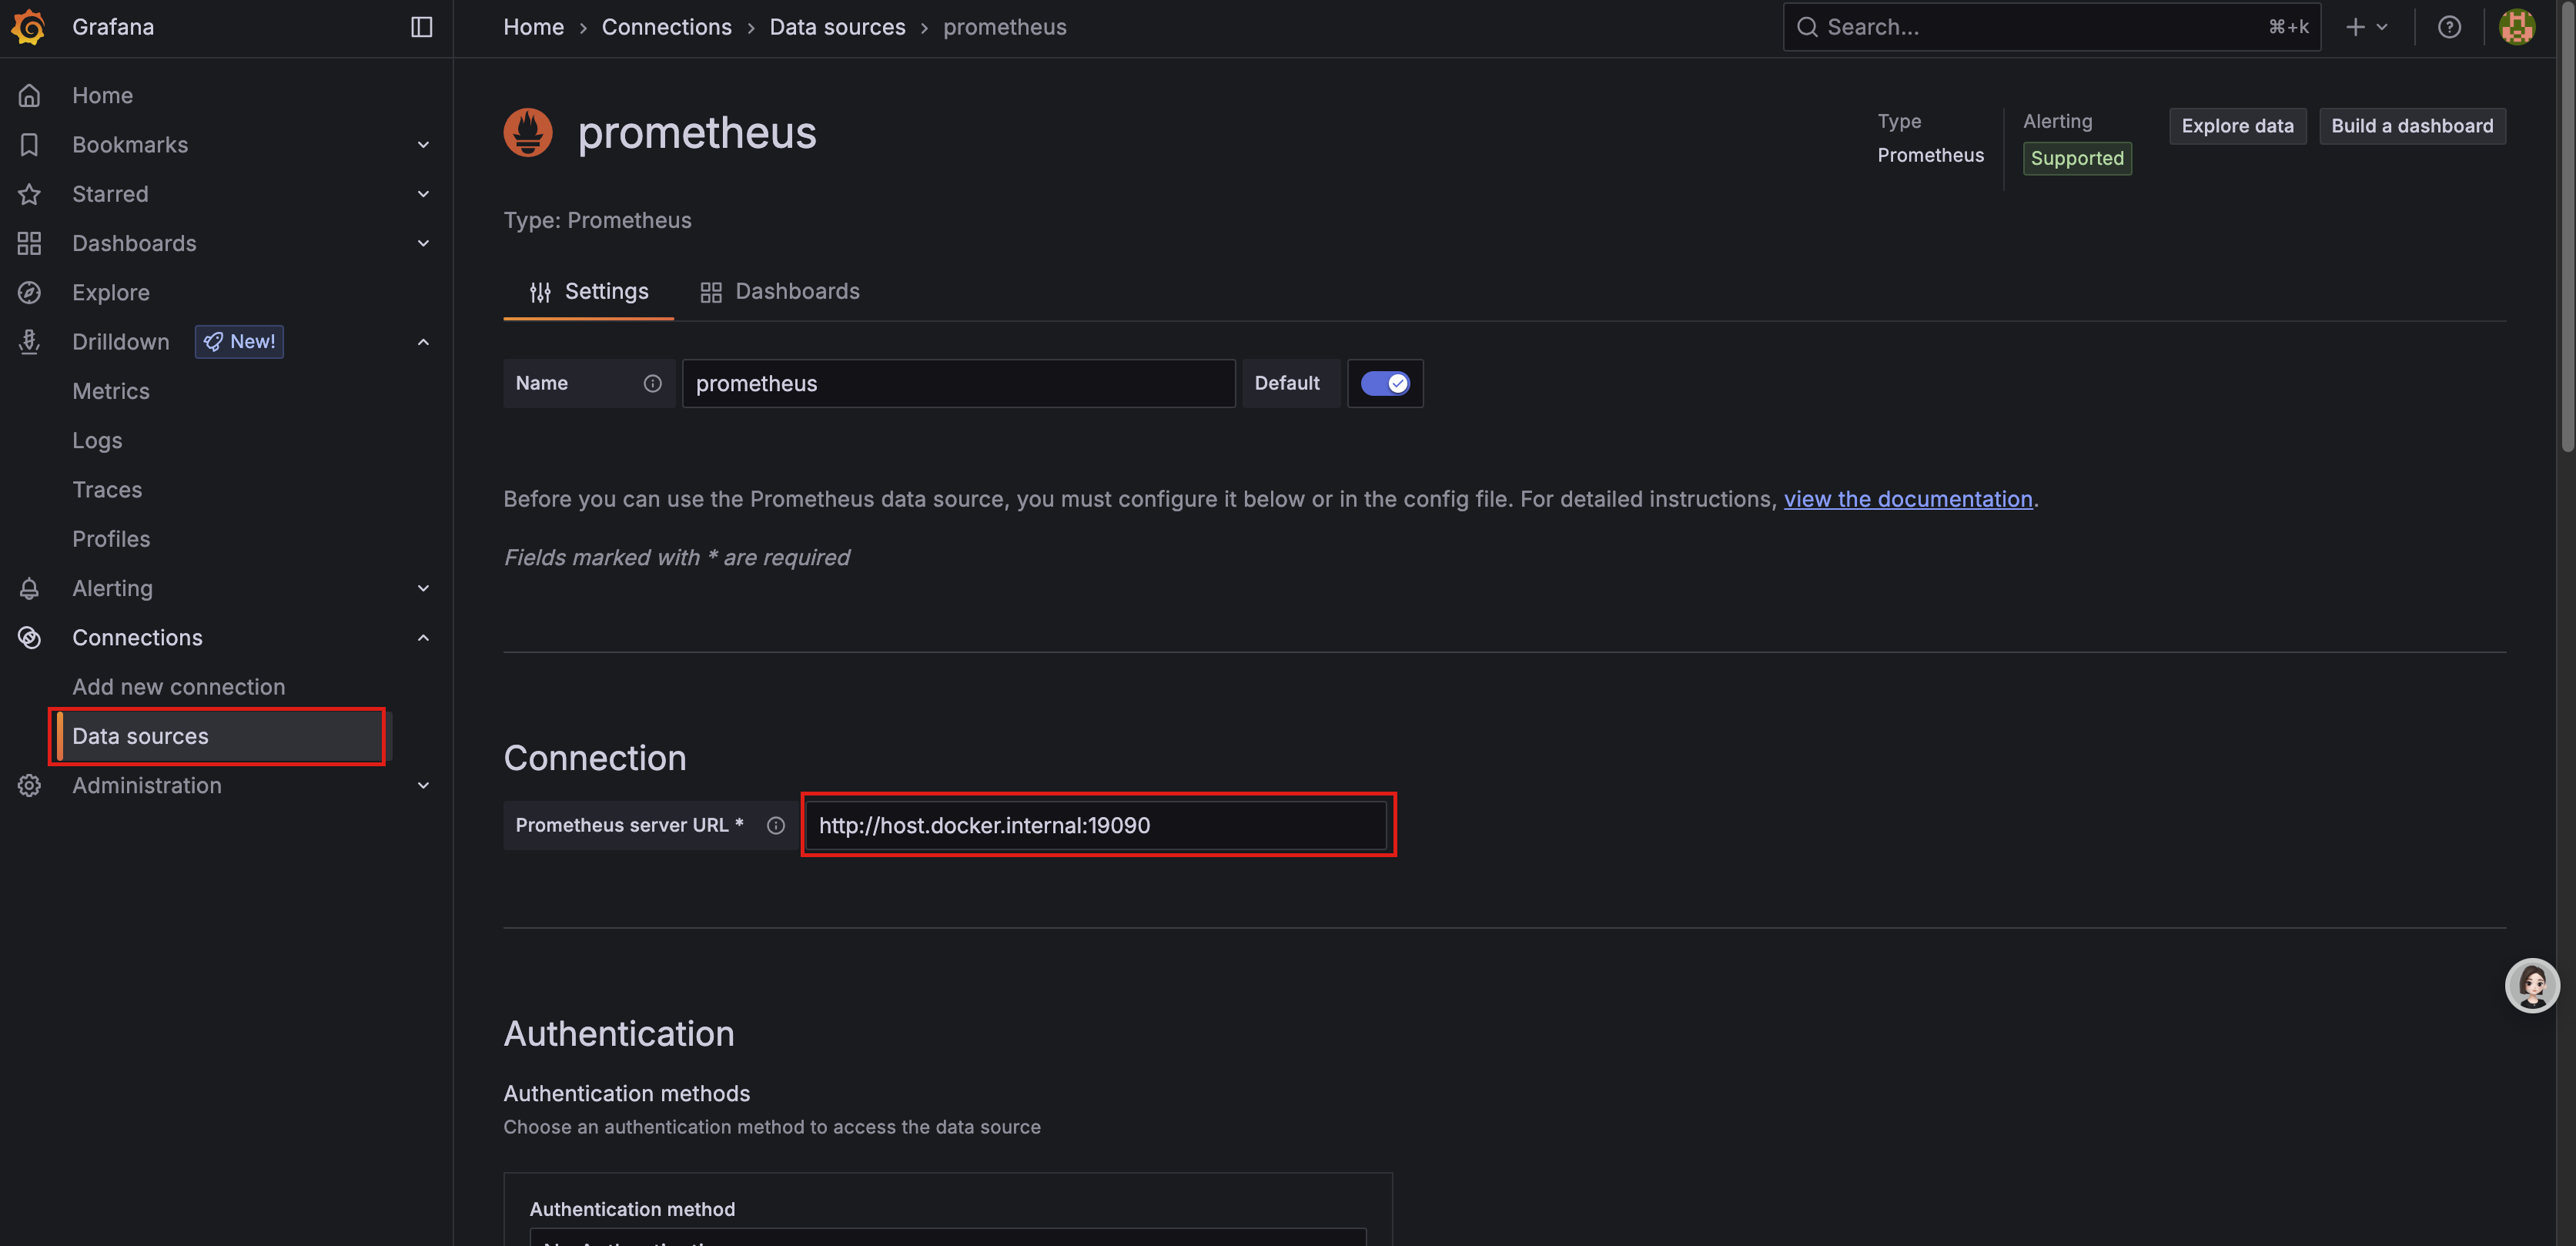
创建Grafana数据源Data sources

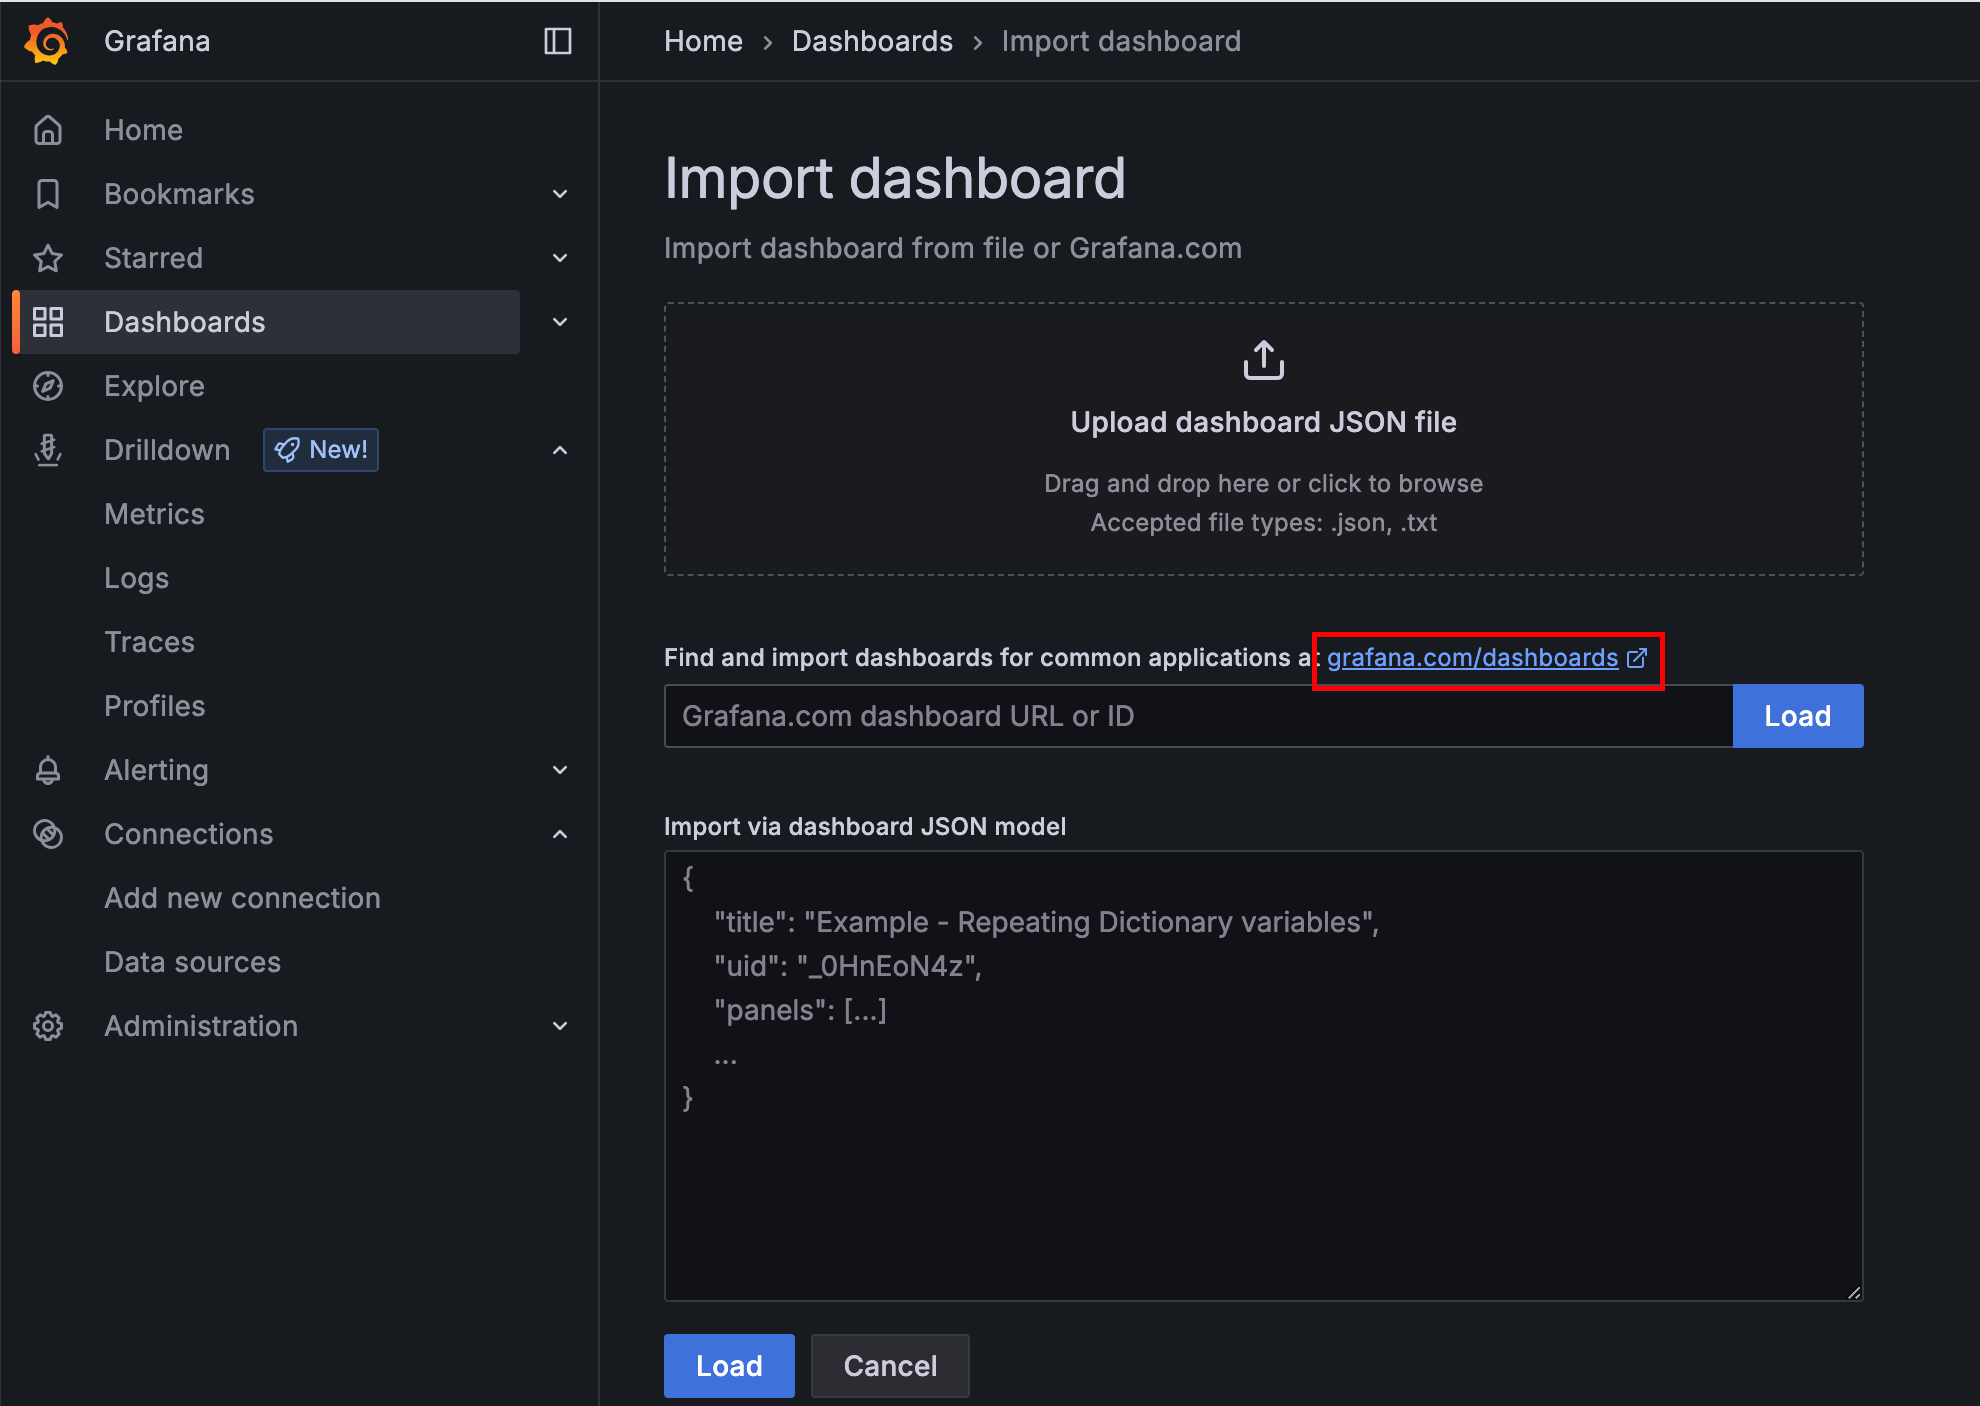
导入一个前人整好的PG监控界面

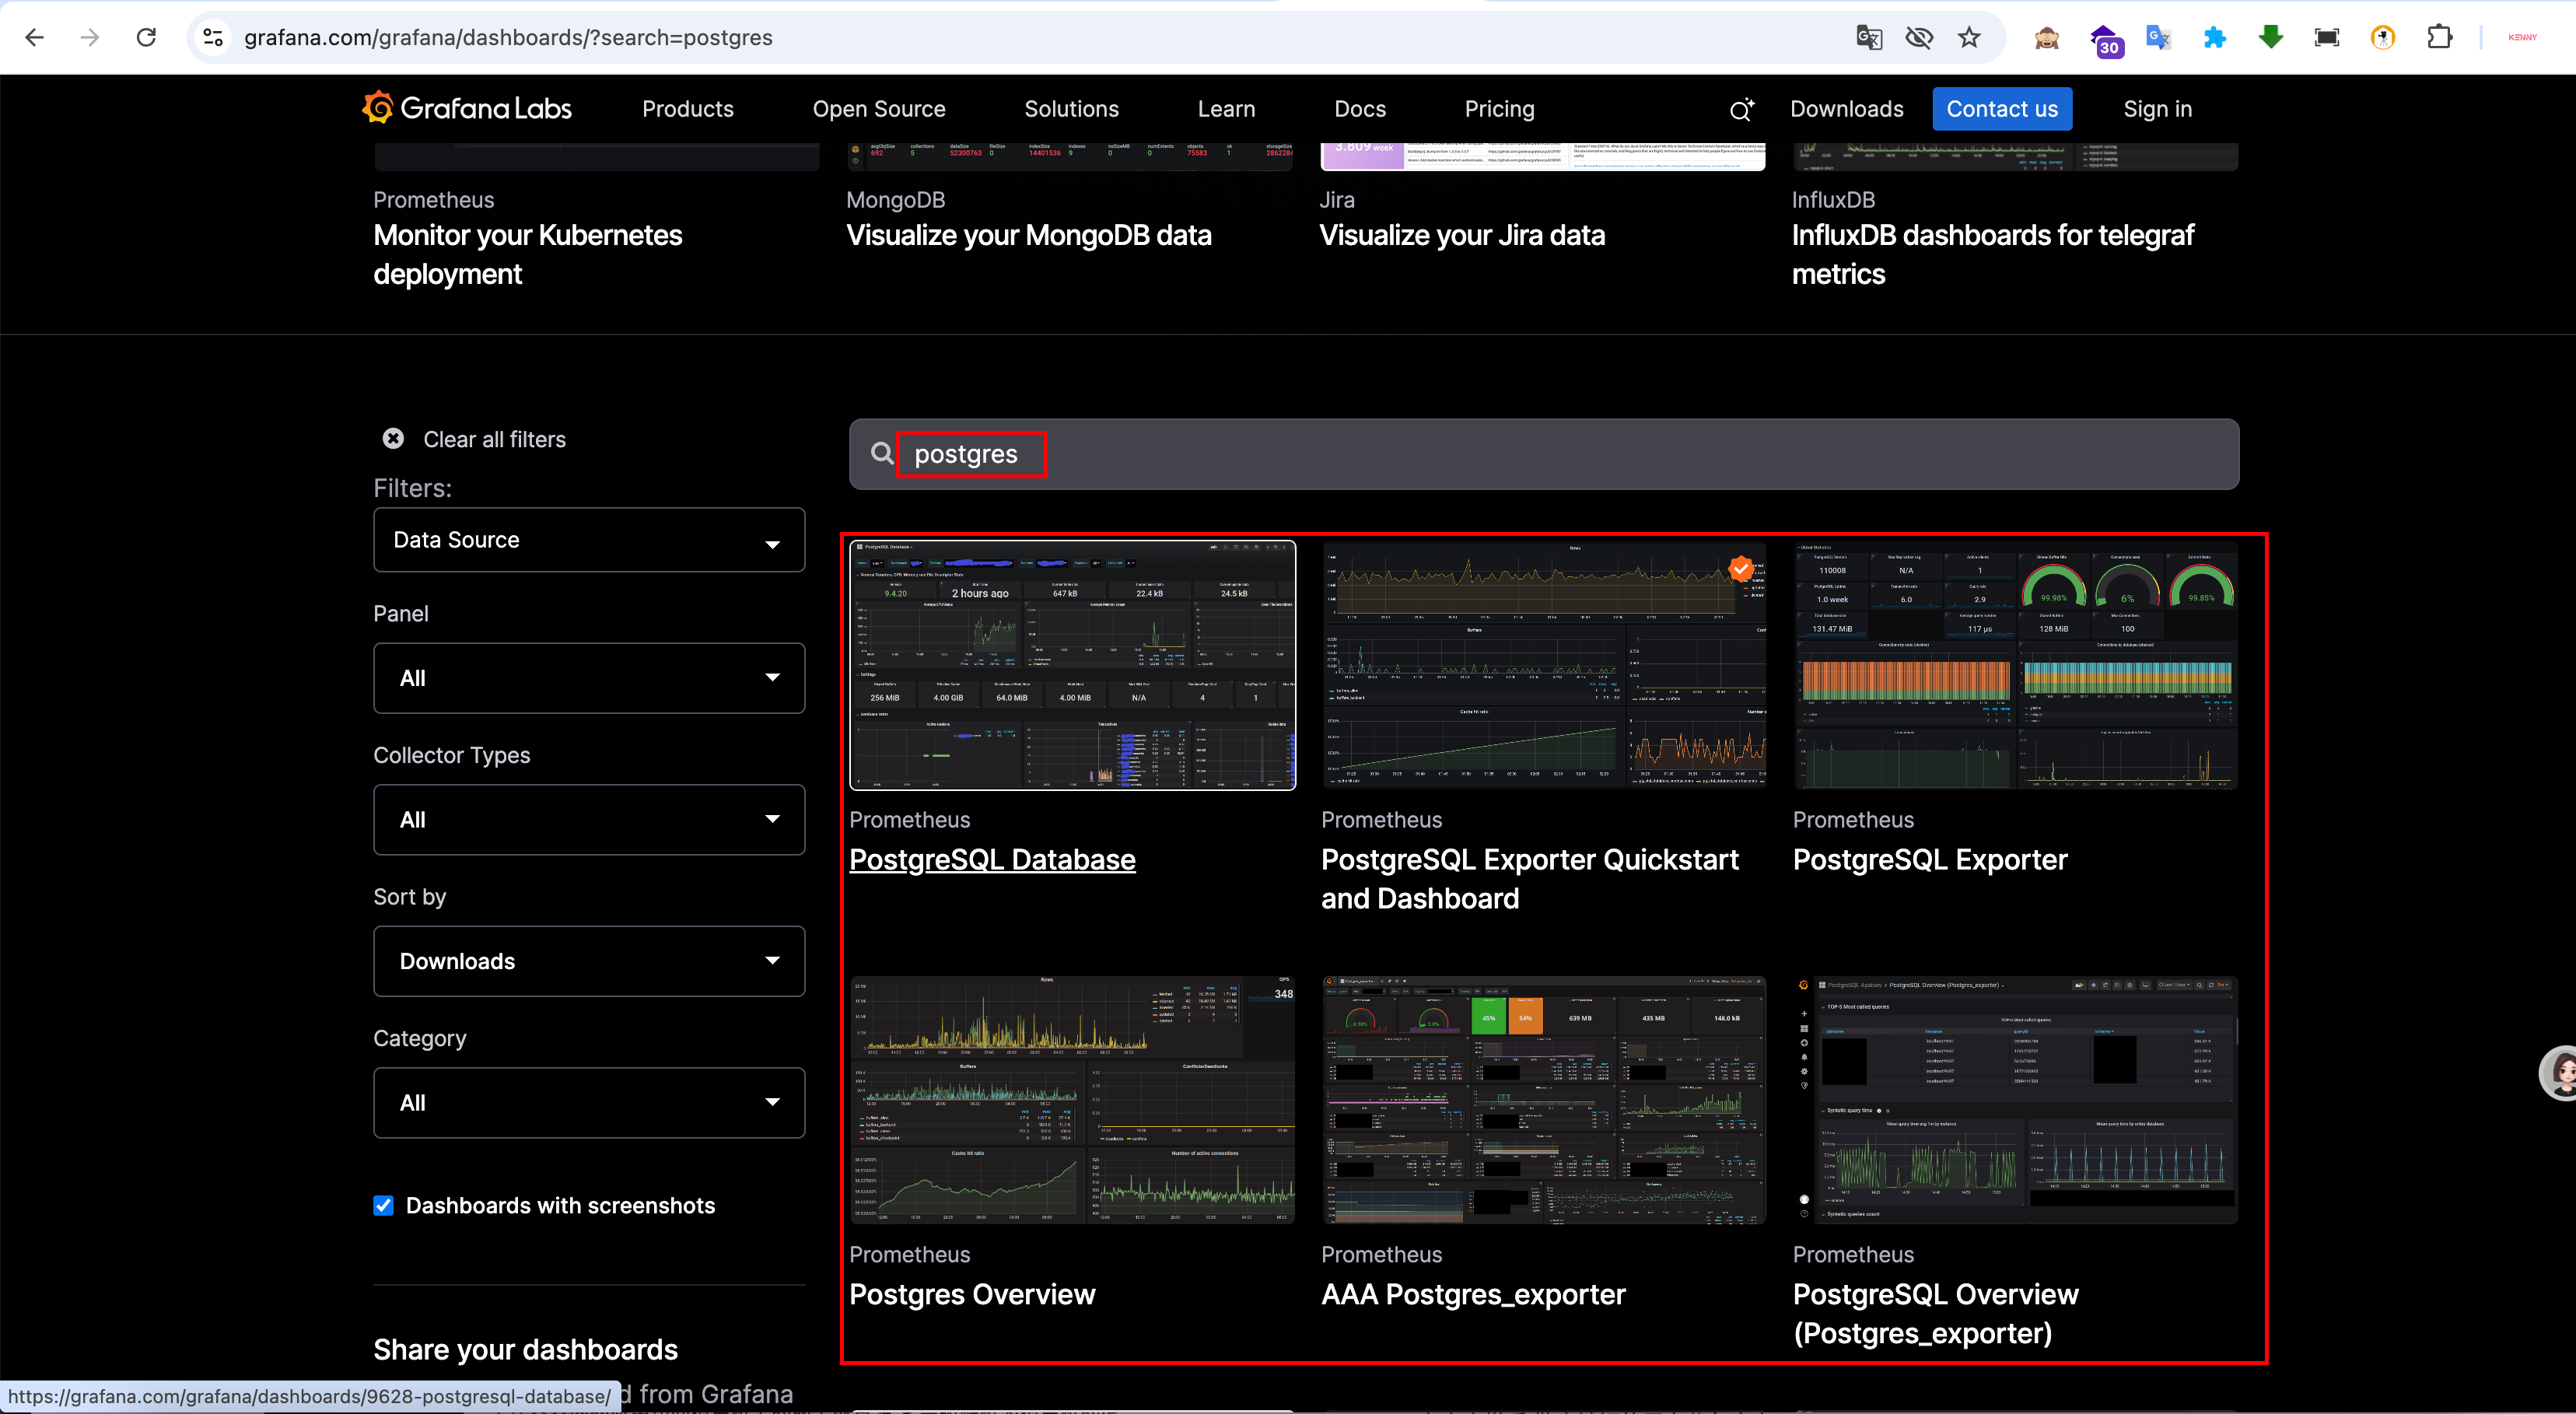
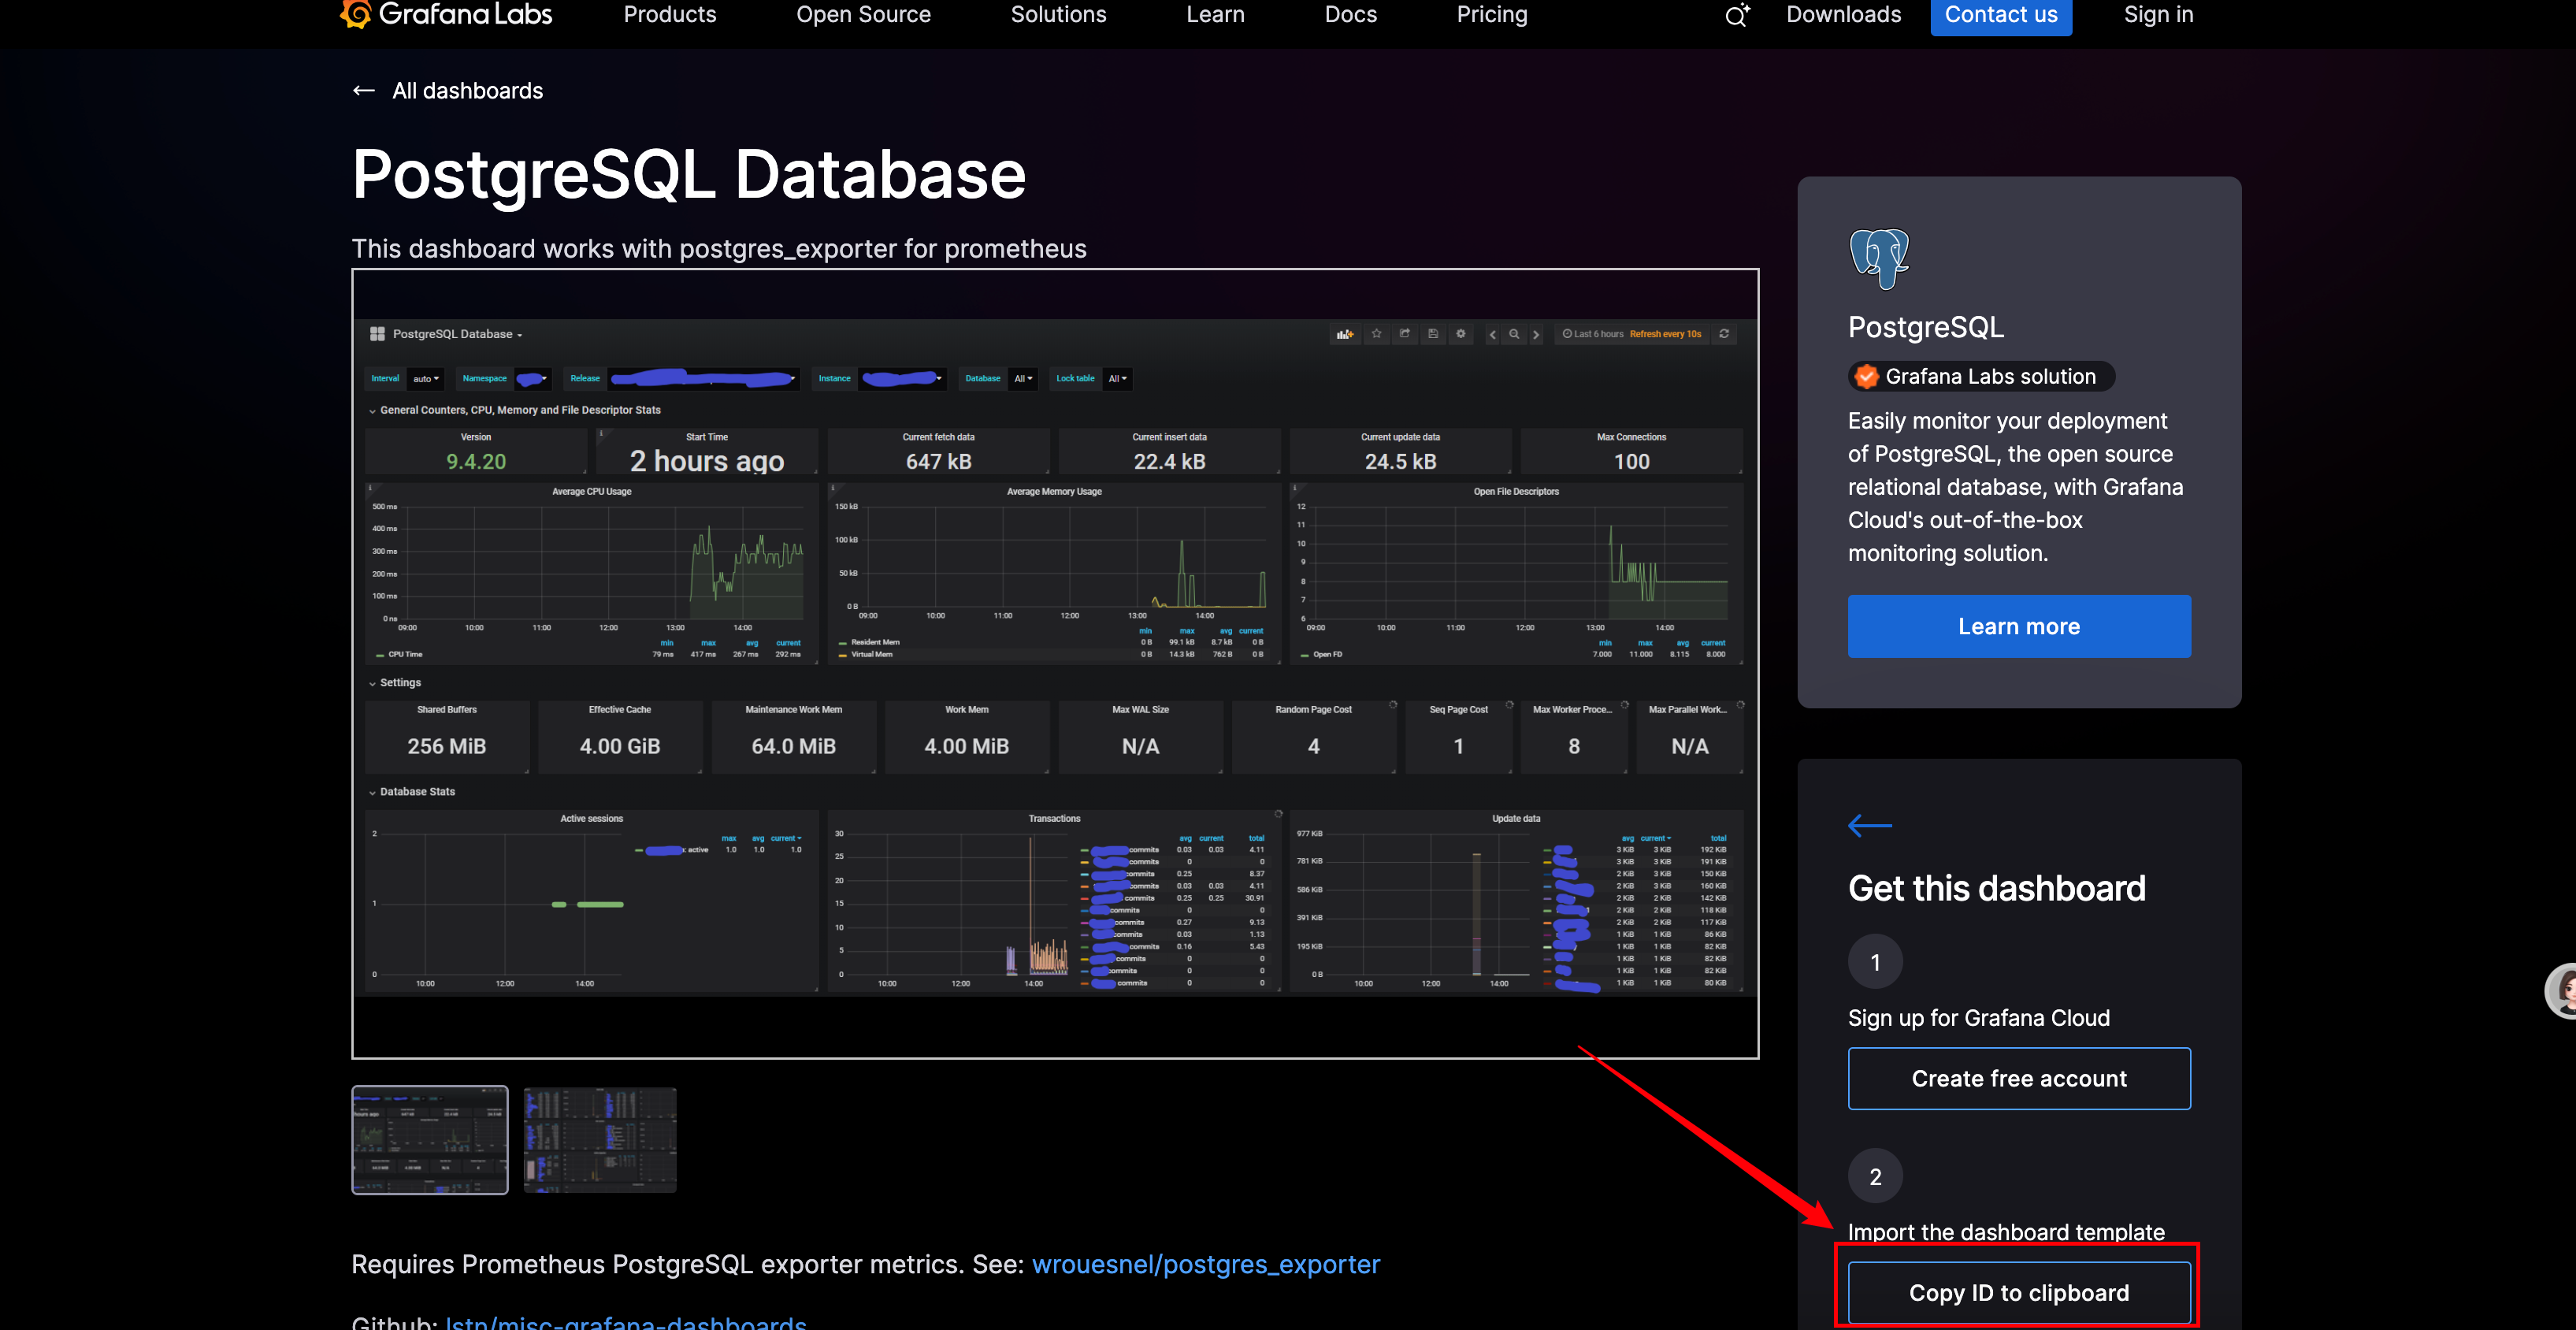
搜索Postgres Exporter案例面板,并复制对应的ID号码

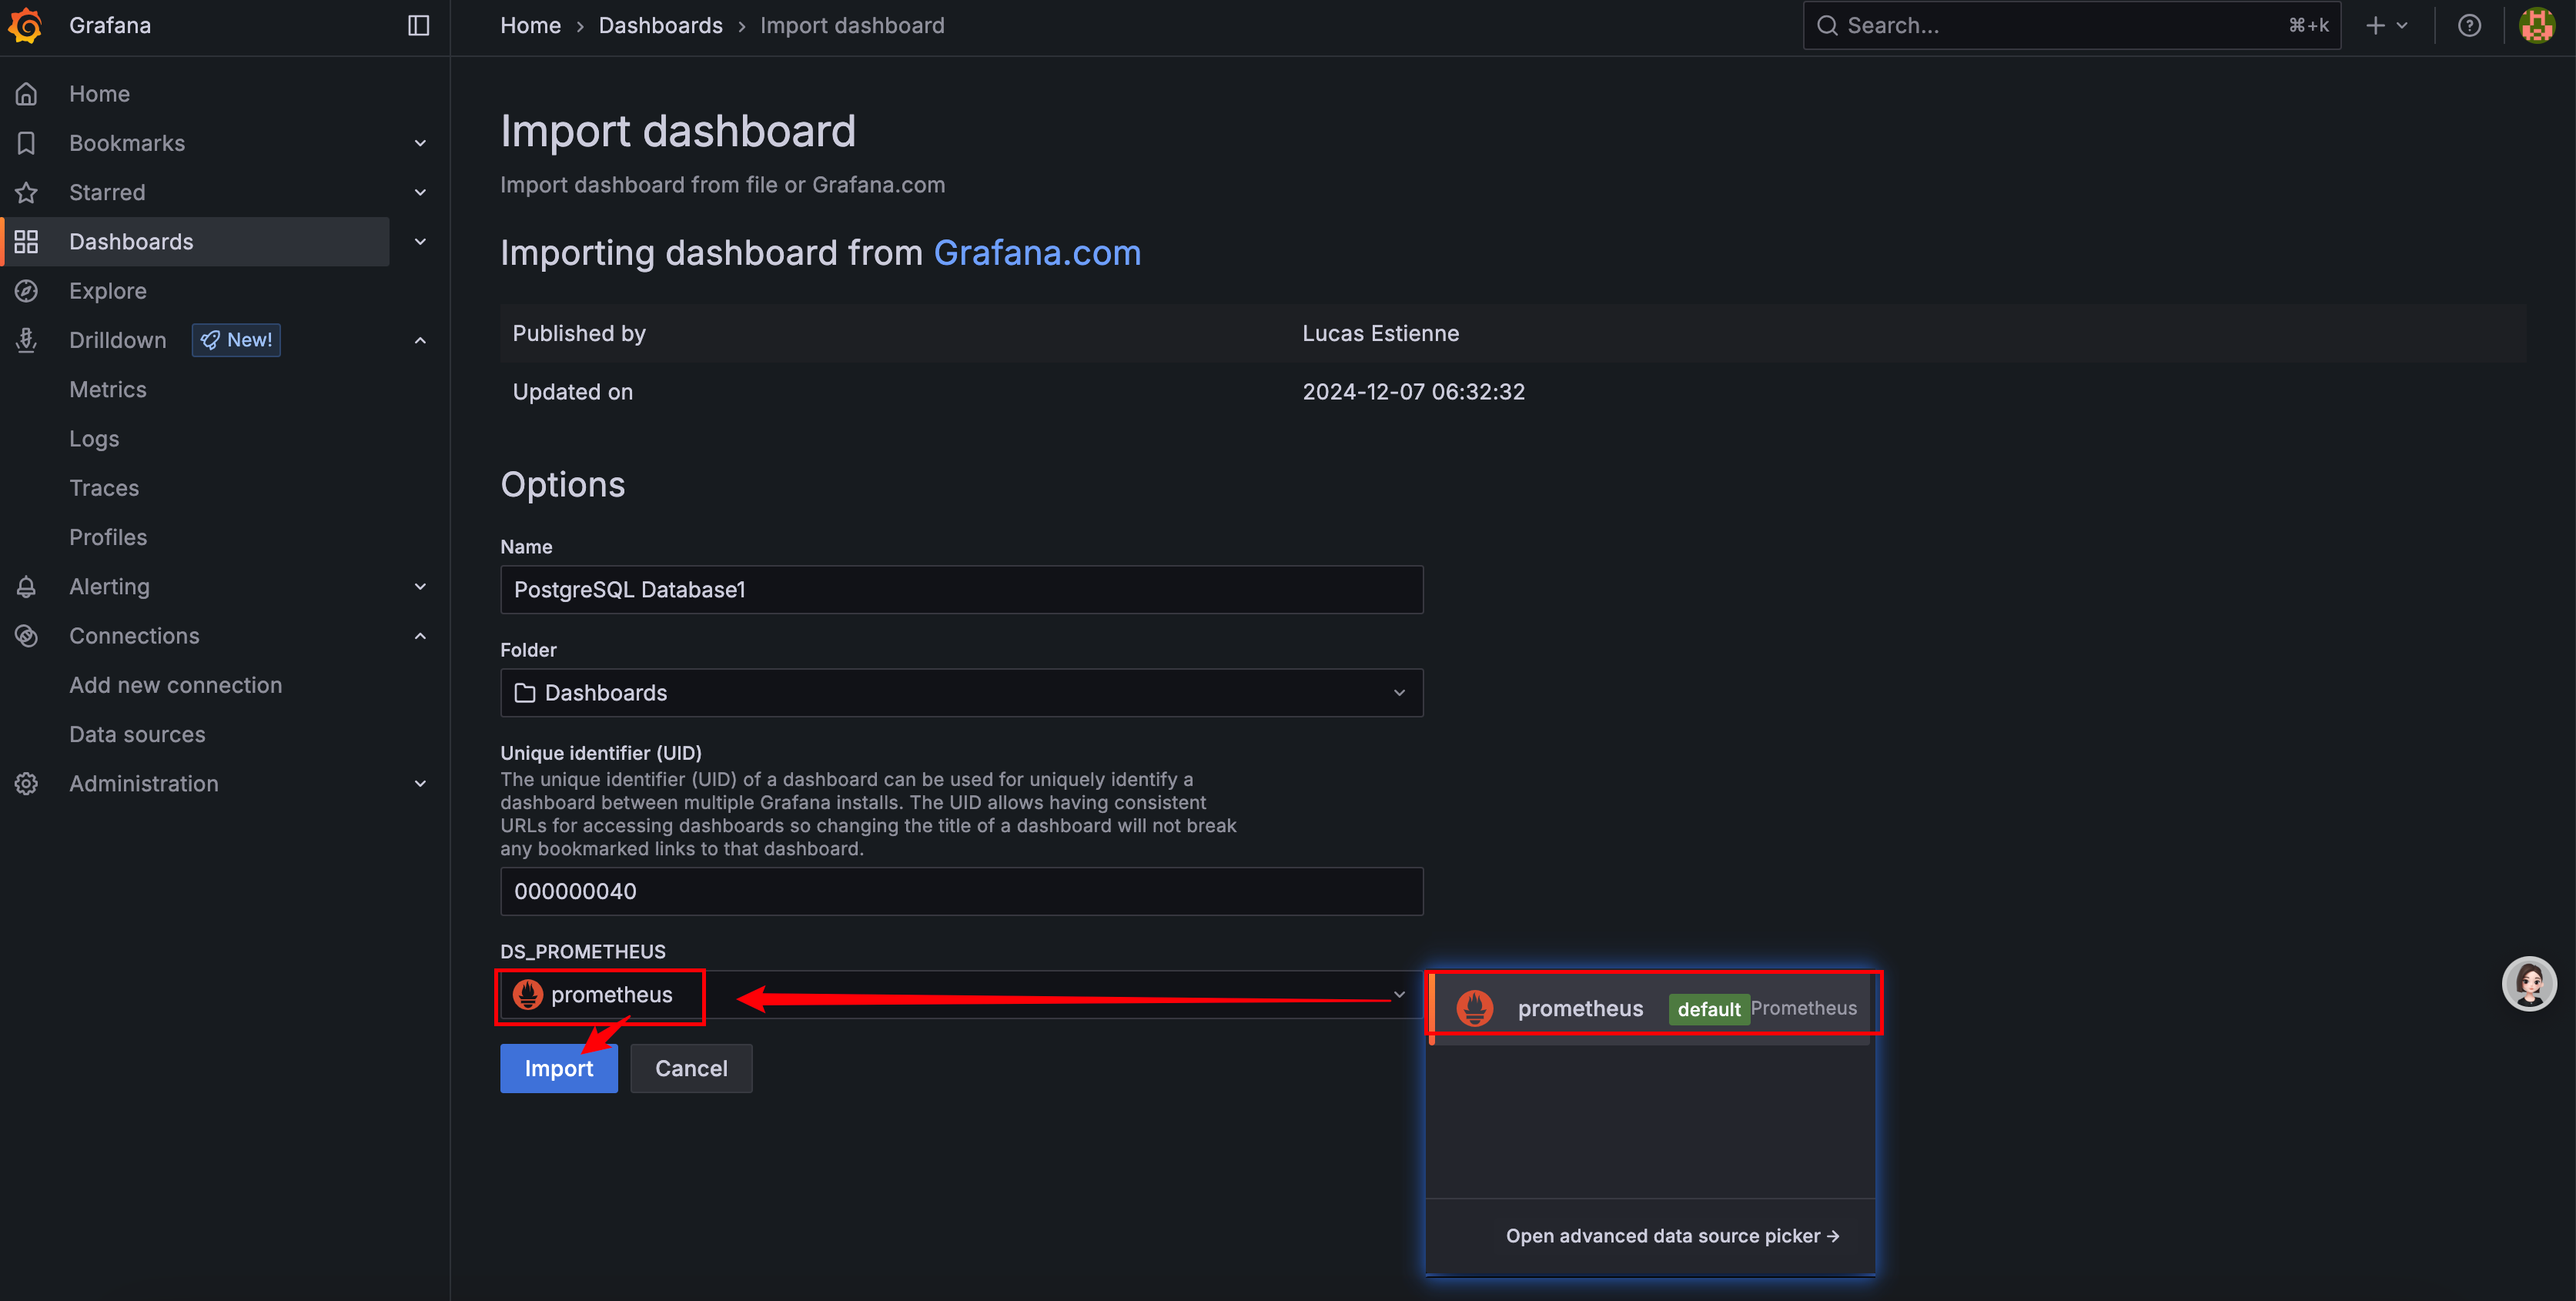
粘贴对应的ID并Load加载

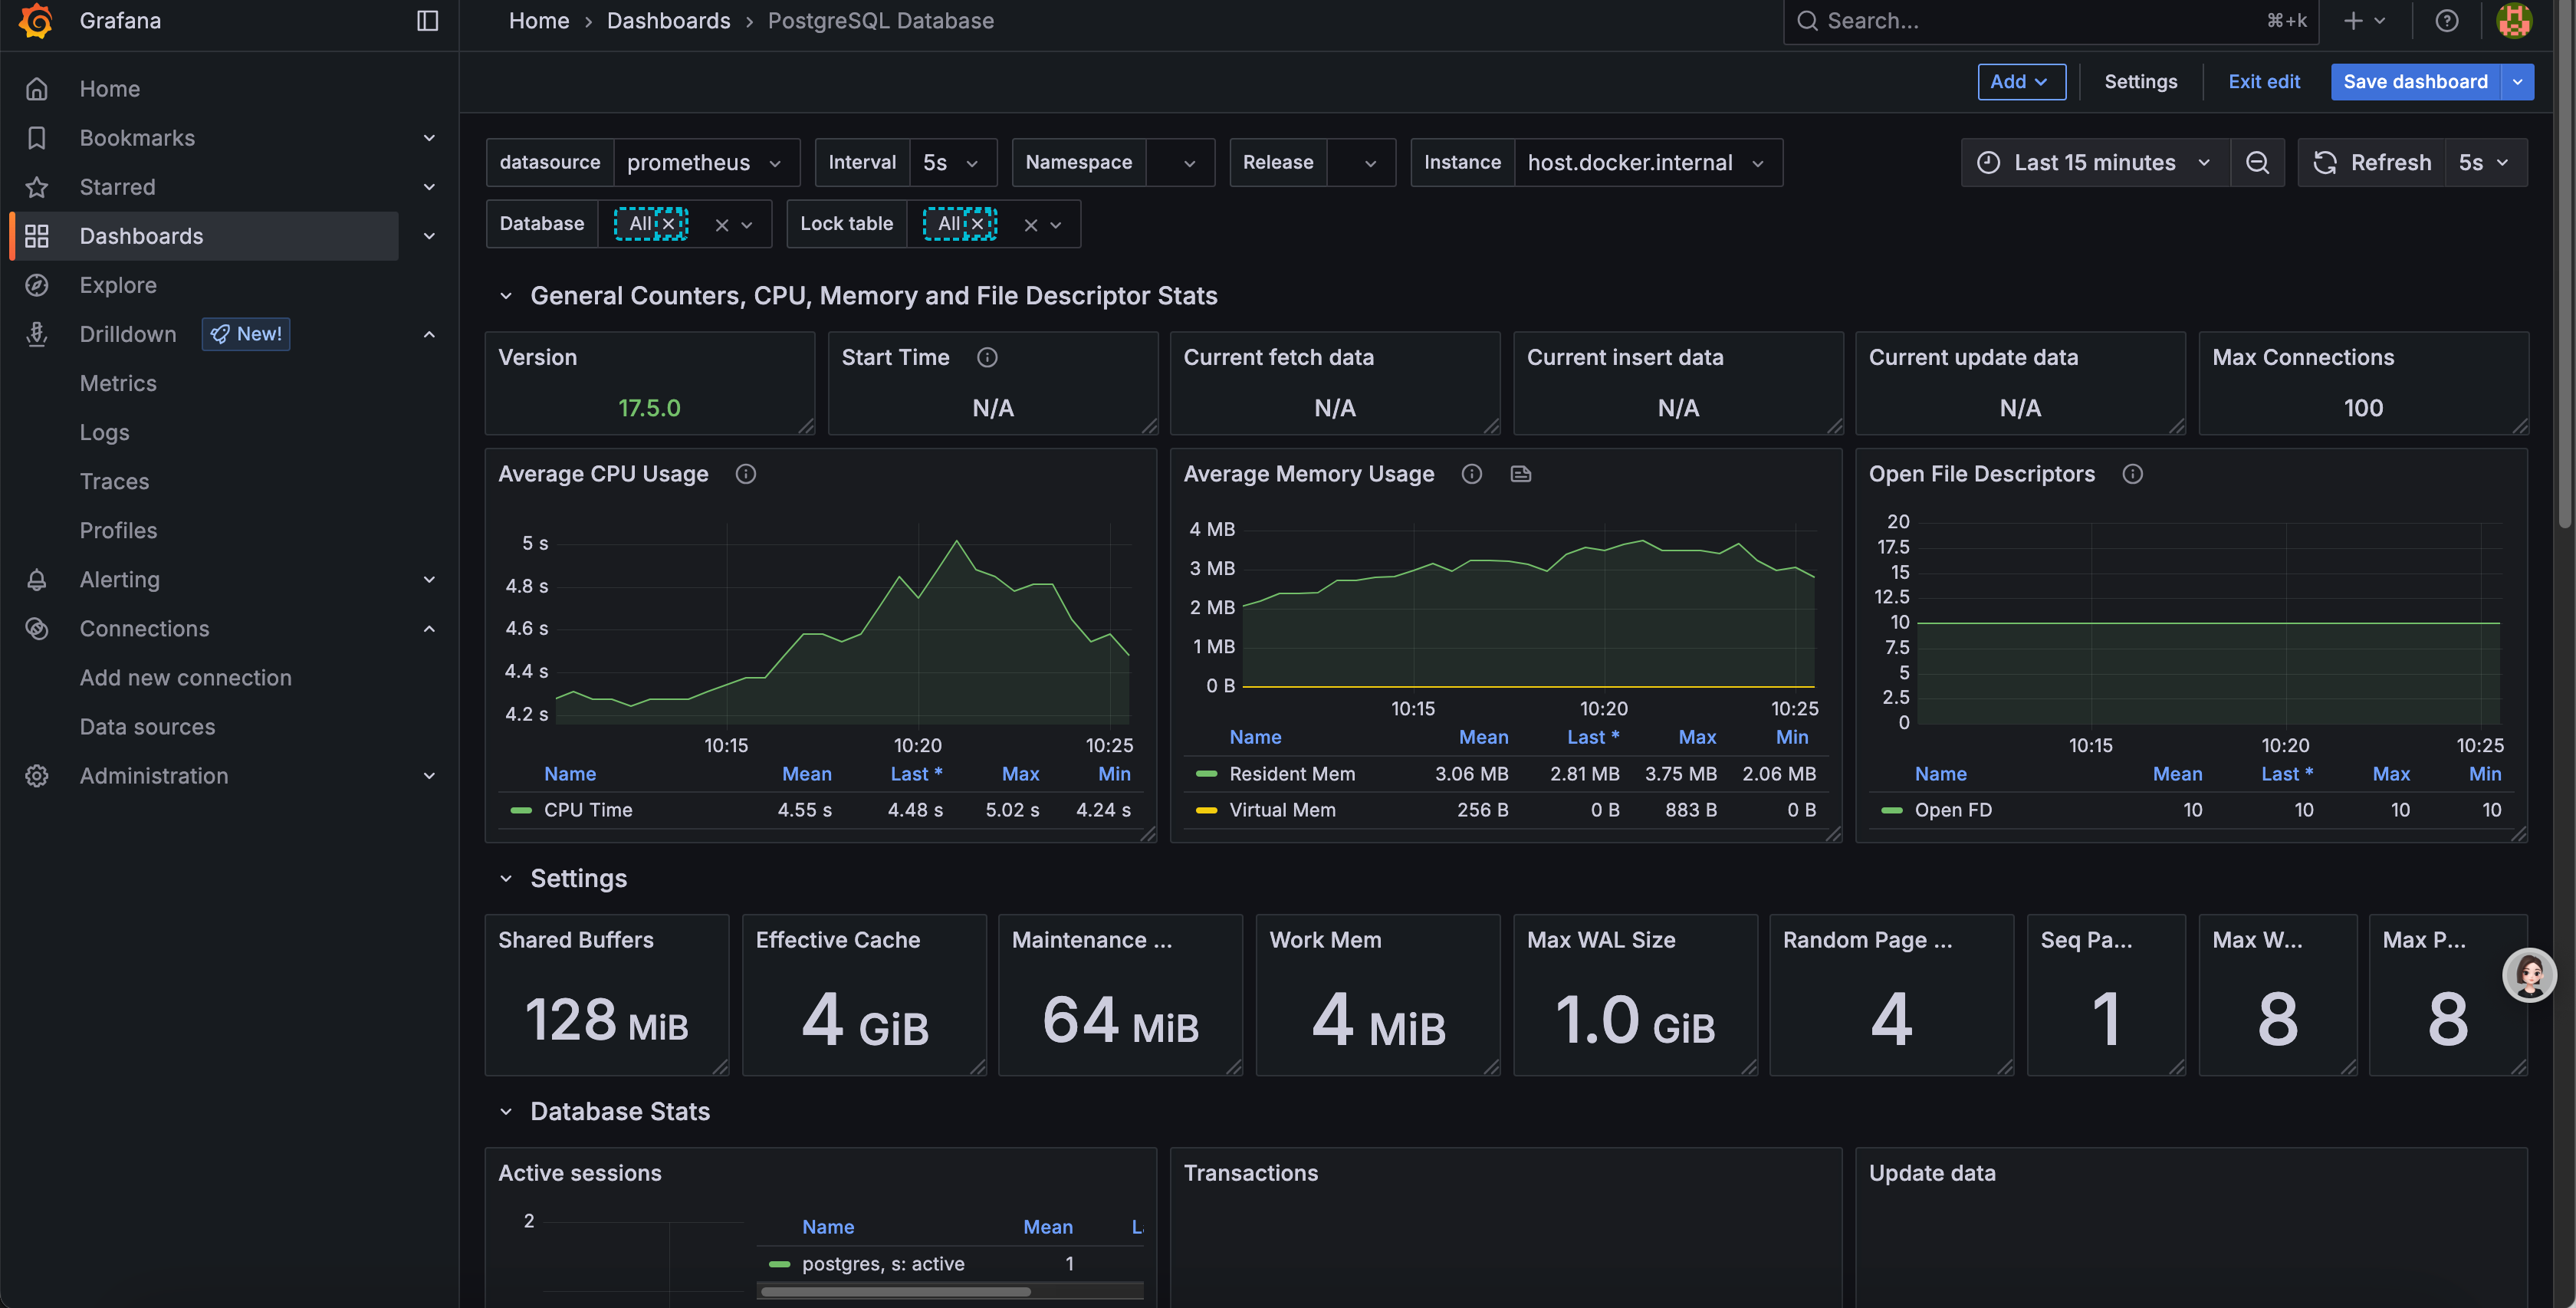
查看我们的监控面板数据是否正常